. 2020 Apr 22;9:e54445. doi: 10.7554/eLife.54445

Figure 3. Nodal ligands promote ex vivo C and E of blastoderm explants.

(A) Diagram of injection and explantation of zebrafish embryos. (B–E) Representative bright-field images of live blastoderm explants of the indicated conditions/genotypes at the equivalent of the 2–4 somite stage. (F) Time-lapse DIC series of a representative explant from a WT embryo injected with 10 pg ndr2 RNA. (G, H) Time-lapse series of H2B-RFP labeled nuclei (G) and automated cell tracking (H) within a representative explant from a WT embryo injected with 10 pg ndr2 RNA. Tracks represent cell movements over 3.5 hr of time-lapse confocal imaging beginning at 7.5 hpf and are colored according to mean track displacement. (I, J) Displacement of cell tracks in the ‘mediolateral’ (I) and ‘anteroposterior’ (J) dimensions in explants from ndr2-injected (blue) and control RFP-injected (gray) WT embryos (as in Figure 1). Each dot represents a single cell track, each color represents an individual explant. N = 4 explants of each condition from two independent trials. (K) Absolute displacement of cell tracks in the ML and AP dimensions. (L) Representative images of WISH for the transcripts indicated in explants from WT embryos injected with 10 pg ndr2 RNA. Scale bars are 200 μm.

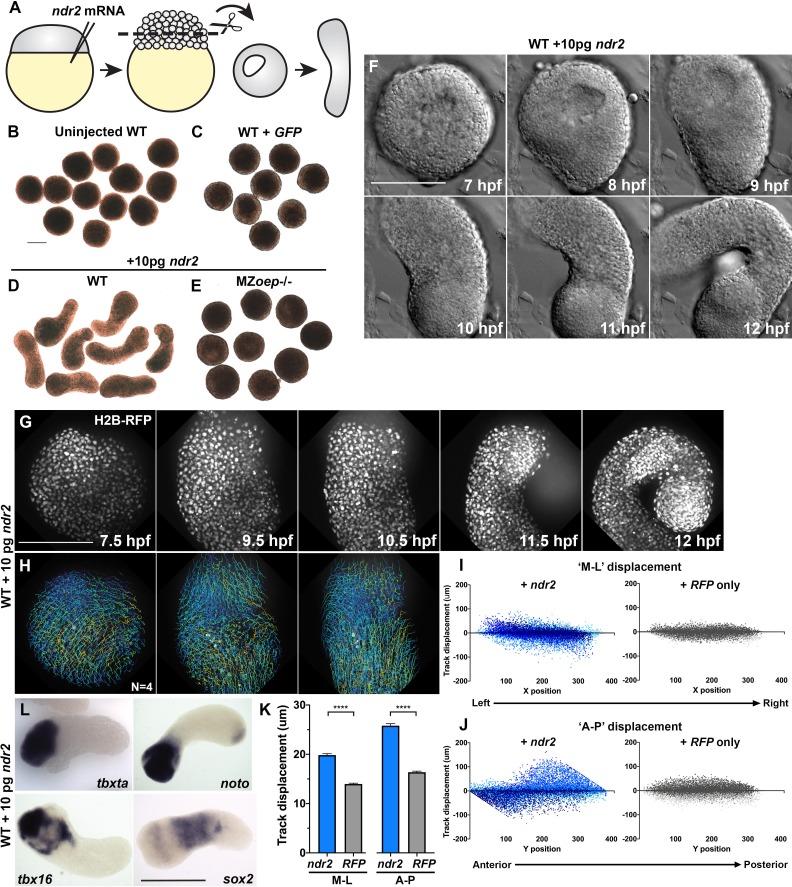
Figure 3.

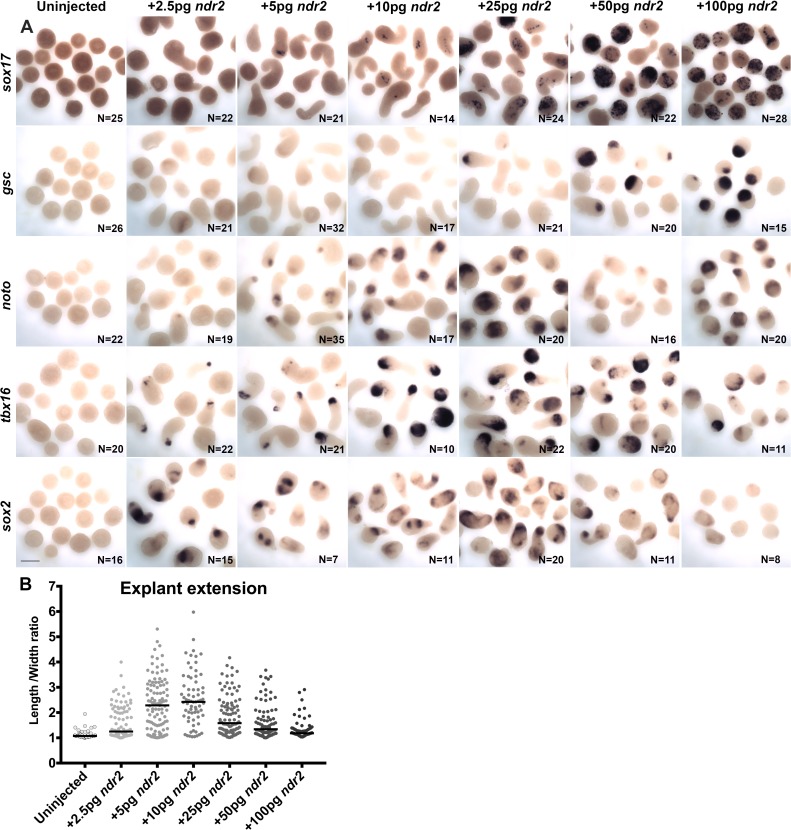
Figure 3—figure supplement 1. Nodal ligand levels regulate cell fate and extension of explants.

Figure 3—figure supplement 1.

(A) Representative images of WISH for the transcripts indicated in explants from WT embryos injected with 0–100 pg ndr2 RNA and fixed at the equivalent of the 2–4 somite stage from two independent trials. (B) Length/width ratios of the explants depicted in (A). Each dot represents a single explant, black bars are median values. Scale bar is 200 μm.
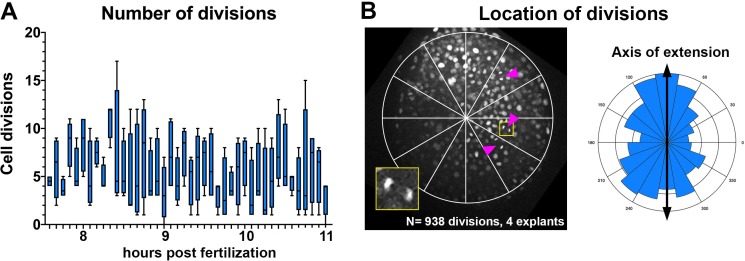
Figure 3—figure supplement 2. Cell divisions within ndr2-expressing explants.

Figure 3—figure supplement 2.

(A) Manually annotated cell divisions (per explant) within four live explants from WT embryos co-injected with H2B-RFP and 10 pg ndr2 RNA. Measurements were taken at 5 min intervals from 7.5 to 11 hpf. Boxes represent the 25th to 75th percentiles, whiskers are minimum and maximum vales, bars are median values. (B) Left: representative image of cell divisions (arrowheads) within an explant co-expressing H2B-RFP and ndr2. The inset is enlarged from the region in the yellow square. Right: radial histogram of locations of all cell divisions (with respect to the center of each explant) detected within four ndr2-expressing explants between 7.5 and 11 hpf, with 90°/270° representing the axis of extension.