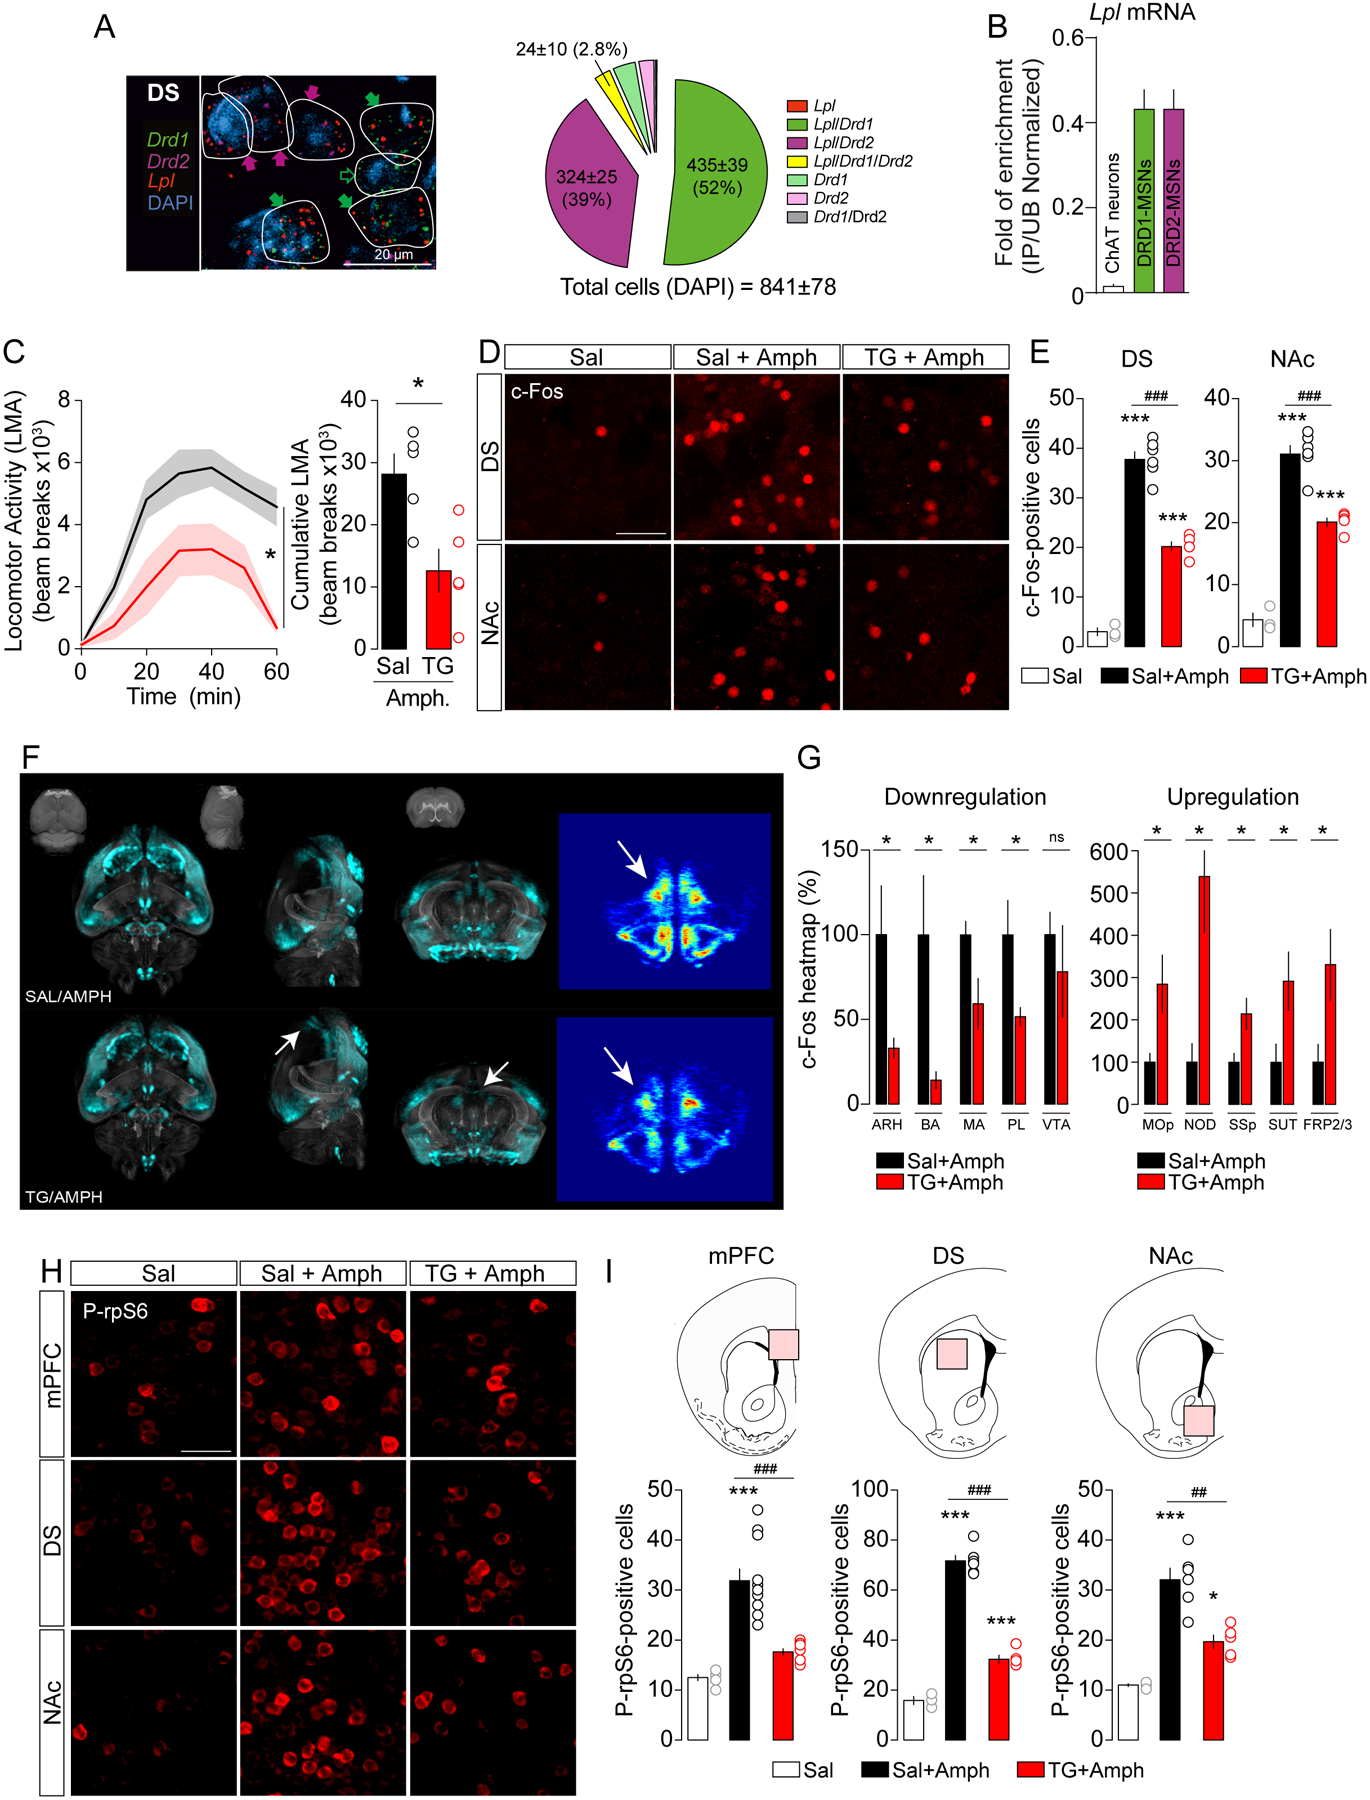
Figure 1. Striatal TG metabolism decreases amphetamine-induced behavioral and molecular adaptations.

(A) Representative photomicrographs and semi-quantitative analysis of RNAscope fluorescence in situ hybridization (FISH) signal for Lipoprotein lipase (Lpl, red), dopamine receptor 1 and 2 (Drd1 green, Drd2 violet) in the dorsal striatum (DS). DAPI (blue) was used to identify cells. Scale bars: 20 μm. The white lines represent the cellular limits. Filled and empty arrows within representative photomicrographs indicate co-expression or absence, respectively, of Lpl according to the presence of Drd1 (green arrows) and Drd2 (violet arrows) transcripts. (B) Translating ribosome affinity purification (TRAP) technique (Doyle et al., 2008) reveals a specific enrichment of Lpl mRNA in medium spiny neurons (MSNs) as compared to cholinergic neurons in the striatum. Each immunoprecipitation (IP) is compared to the average of unbound (UB) samples from the same tissue to calculate a ratio of IP/UB as a measure of enrichment. IP/UB are represented for cholinergic, DRD1- and DRD2-expressing MSNs. (C) Amphetamine (Amph)-induced locomotor activity (LMA) and cumulative LMA after a 6-hrs saline (Sal, n=5) or TG (TG, n=5) central perfusion followed by amphetamine administration (3 mg/kg). Statistics: *p<0.05 Sal vs TG. (D, E) Representative confocal photomicrographs and quantification of c-Fos-positive cells in the dorsal striatum (DS) and the nucleus accumbens (NAc) of animals infused with saline and injected with saline (Sal, n=3) or amphetamine (Sal+Amph, n=6) and animals infused with TG and injected with amphetamine (TG+Amph, n=5). Scale bars: 50 μm. Statistics: ***p<0.001 Sal vs Sal+Amph or Sal vs TG+Amph; ###p<0.001 Sal+Amph vs TG+Amph). (F, G) Representative pictures showing whole-brain c-Fos-based signal and heatmaps quantification of brain structures in which central TG perfusion (TG/AMPH, n=5) negatively or positively affect amphetamine-induced c-Fos response compared to controls (Sal/AMPH, n=5). ARH: Arcuate hypothalamic nucleus, BA: Bed nucleus of the accessory olfactory tract, MA: Magnocellular nucleus, PL: Prelimbic area, VTA: Ventral tegmental area, Mop: Primary motor area, NOD: Nodulus (X), SSP: Primary somatosensory area, SUT: Supratrigeminal nucleus, FRP2/3: Frontal pole, layer 2/3. Statistics: *p<0.05 TG+Amph vs Sal+Amph. (H, I) Representative confocal photomicrographs and quantification of phosphorylated ribosomal protein S6 (Ser235/236)-positive cells in the medial prefrontal cortex (mPFC), dorsal striatum (DS) and nucleus accumbens (NAc) of animals infused with saline and injected with saline (Sal, n=3) or amphetamine (Sal+Amph, n=6) and animals infused with TG and injected with amphetamine (TG+Amph, n=5). Statistics: ***p<0.001 Sal vs Sal+Amph; ###p<0.001 TG+Amph vs Sal+Amph), ##p<0.01 TG+Amph vs Sal+Amph). For statistical details see Table S5.
