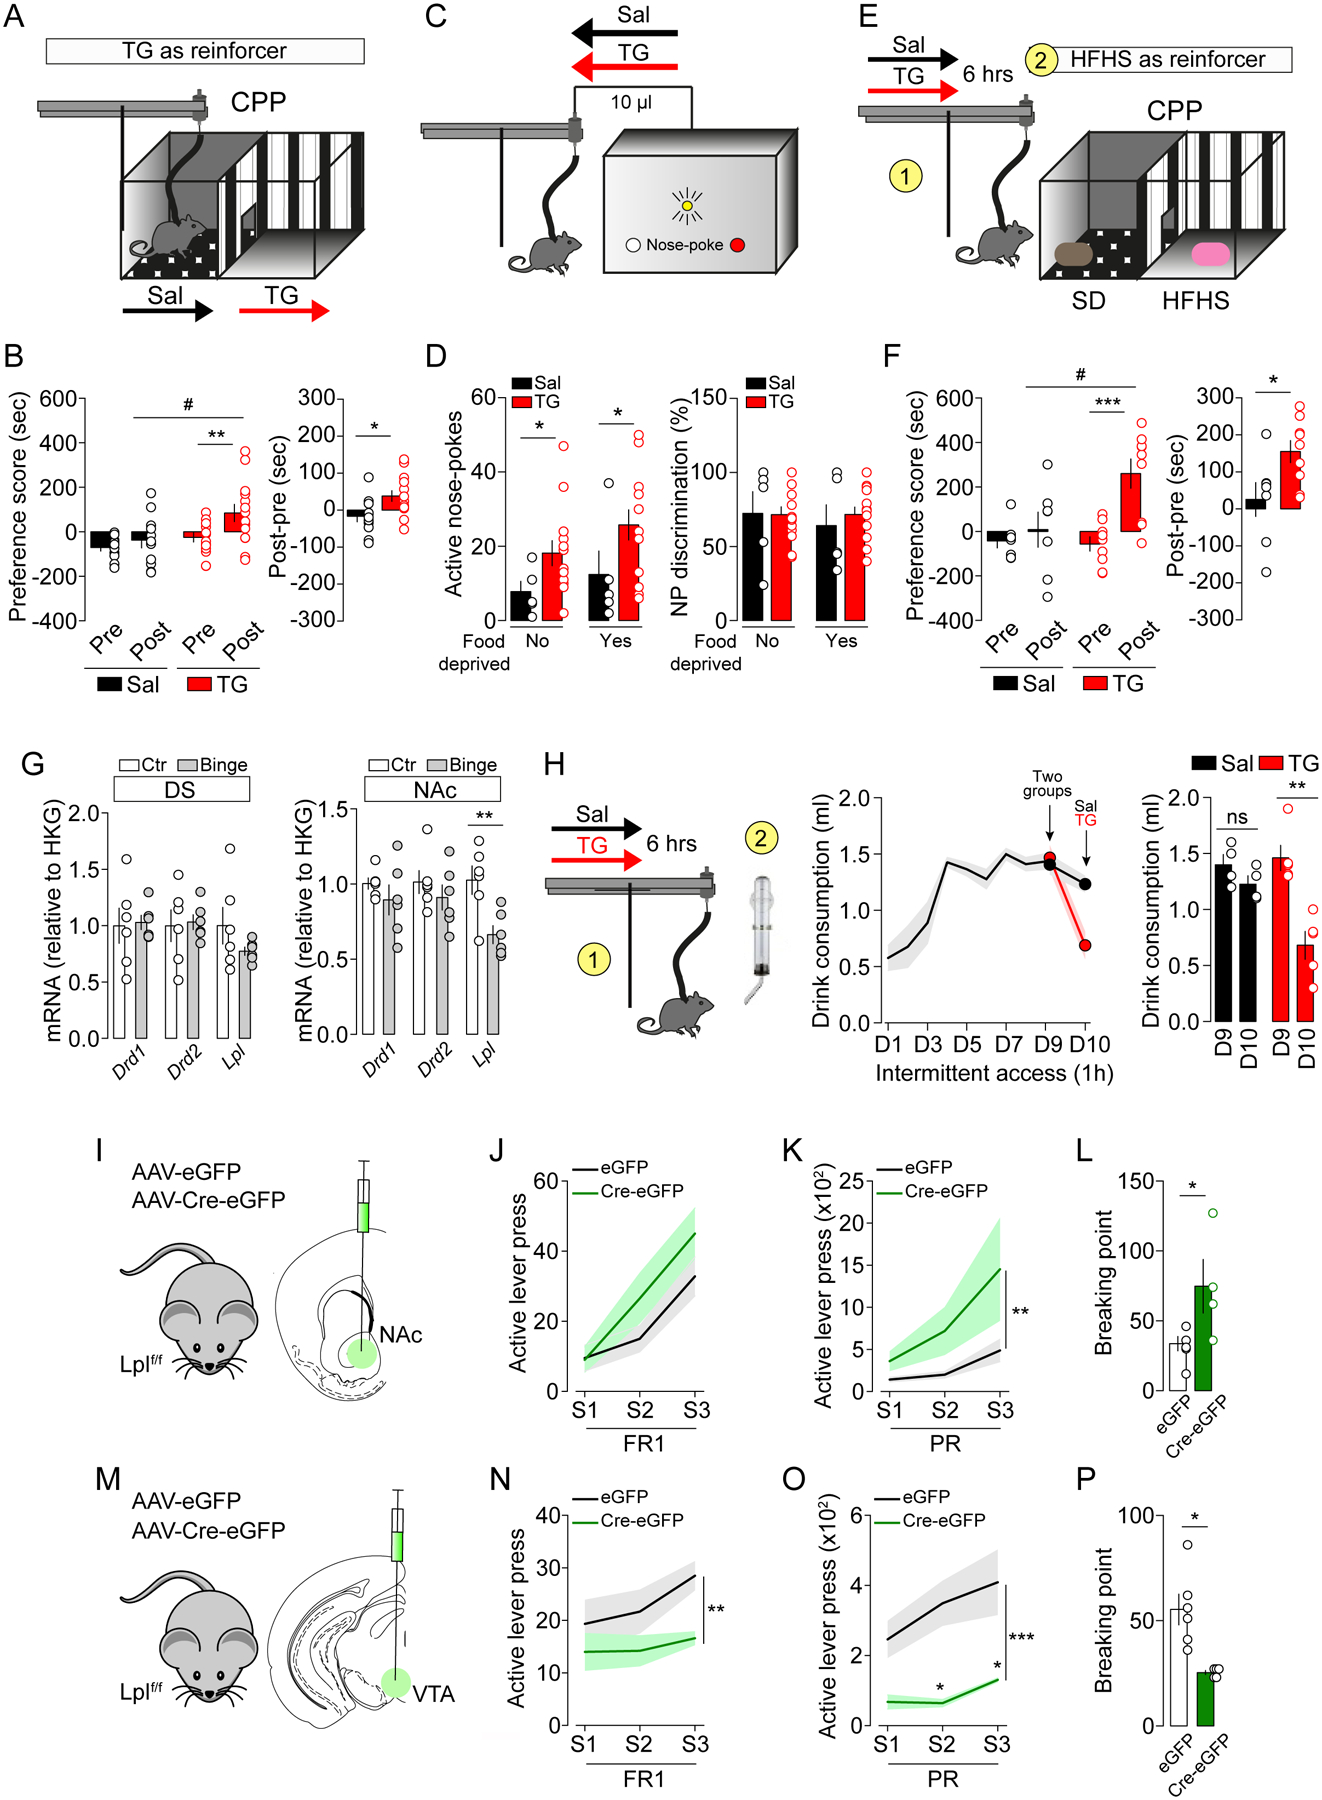
Figure 5. Central TG-sensing is reinforcing and modulates food reward.

(A) Experimental design of the conditioned place preference (CPP) using central TG delivery as reinforcer. On day 1, animals are put in the middle of the cage and explore freely the two compartments of the apparatus for 15 minutes. The following days of conditioning sessions (1 hour each session) the animals learn to associate one or another compartment to central delivery of saline (Sal) or triglycerides (TG). After 8 days of conditioning (4 sessions in each compartment), animals freely explore the two compartments for 15 minutes. The analysis considers the time spent in the brain TG delivery- or saline-associated compartments before and after conditioning. (B) Preference score of CPP and difference of time spent in the conditioned sites between post-test and pre-test between reinforced and non-reinforced compartments. Statistics: **p<0.01 TG-Post vs TG-Pre, #p<0.05 TG-Post vs Sal-Post, post-pre (*p<0.05 TGPost-Pre vs SalPost-Pre). (C) Experimental design of nosepoke-associated self-administration of saline (Sal, n=5) or triglycerides (TG, n=13). (D) Active nose-pokes and nose-pokes discrimination (distinction between active and inactive nose-pokes, %) are shown in ad libitum and food-deprived conditions. Statistics: *p<0.05 TG vs Sal. (E) Experimental design of CPP using palatable food as reinforcer in mice that received a 6-hours central perfusion of saline (Sal, n=8) or triglycerides (TG, n=9) prior to conditioning sessions. Conditioning consisted in 8 alternated sessions with standard diet (SD) or high-fat high-sucrose (HFHS) diet access for 30 minutes. (F) Preference score of CPP and difference of time spent in the palatable food-associated compartment between post-test and pre-test between reinforced and non-reinforced compartment. Statistics: preference score (***p<0.001 TG-Post vs TG-Pre, #p<0.05 TG-Post vs Sal-Post), post-pre (*p<0.05 TGPost-Pre vs SalPost-Pre). (G) RT-qPCR quantifications of Lpl, Drd1, Drd2 mRNA abundance relative to HKG in dorsal striatum and NAc of mice after a binge-eating protocol consisting of 9 days of intermittent access to palatable fat and sugar beverage. Statistics: NAc Lpl **p<0.01 binge vs control mice. (H) When animal reached a maximum intake (day 9, D9), on D10 they were centrally infused (6-hours) with saline (Sal, n=4) or triglycerides (TG, n=5) before the intermittent access to the palatable drink. The graph shows palatable drink consumption on D9 and D10, prior or after central infusions respectively. Statistics: **p<0.01 D10 vs D9 for TG-group. (I, M) Viral delivery of eGFP or Cre-eGFP in the NAc (I, NAc-Lpllox/lox, n=6; NAc-LplΔ/Δ, n=4) or the VTA (M, VTA-Lpllox/lox, n=6; VTA-LplΔ/Δ, n=5) of Lpllox/lox mice. (J-P) Operant behavior performances in fixed ratio sessions (J, N, FR1: fixed ratio 1), progressive ratio (K, O, PR: progressive ratio) and breaking point (L, P). Statistics: ***p<0.001, **p<0.01 and *p<0.05. For statistical details see Table S5.
