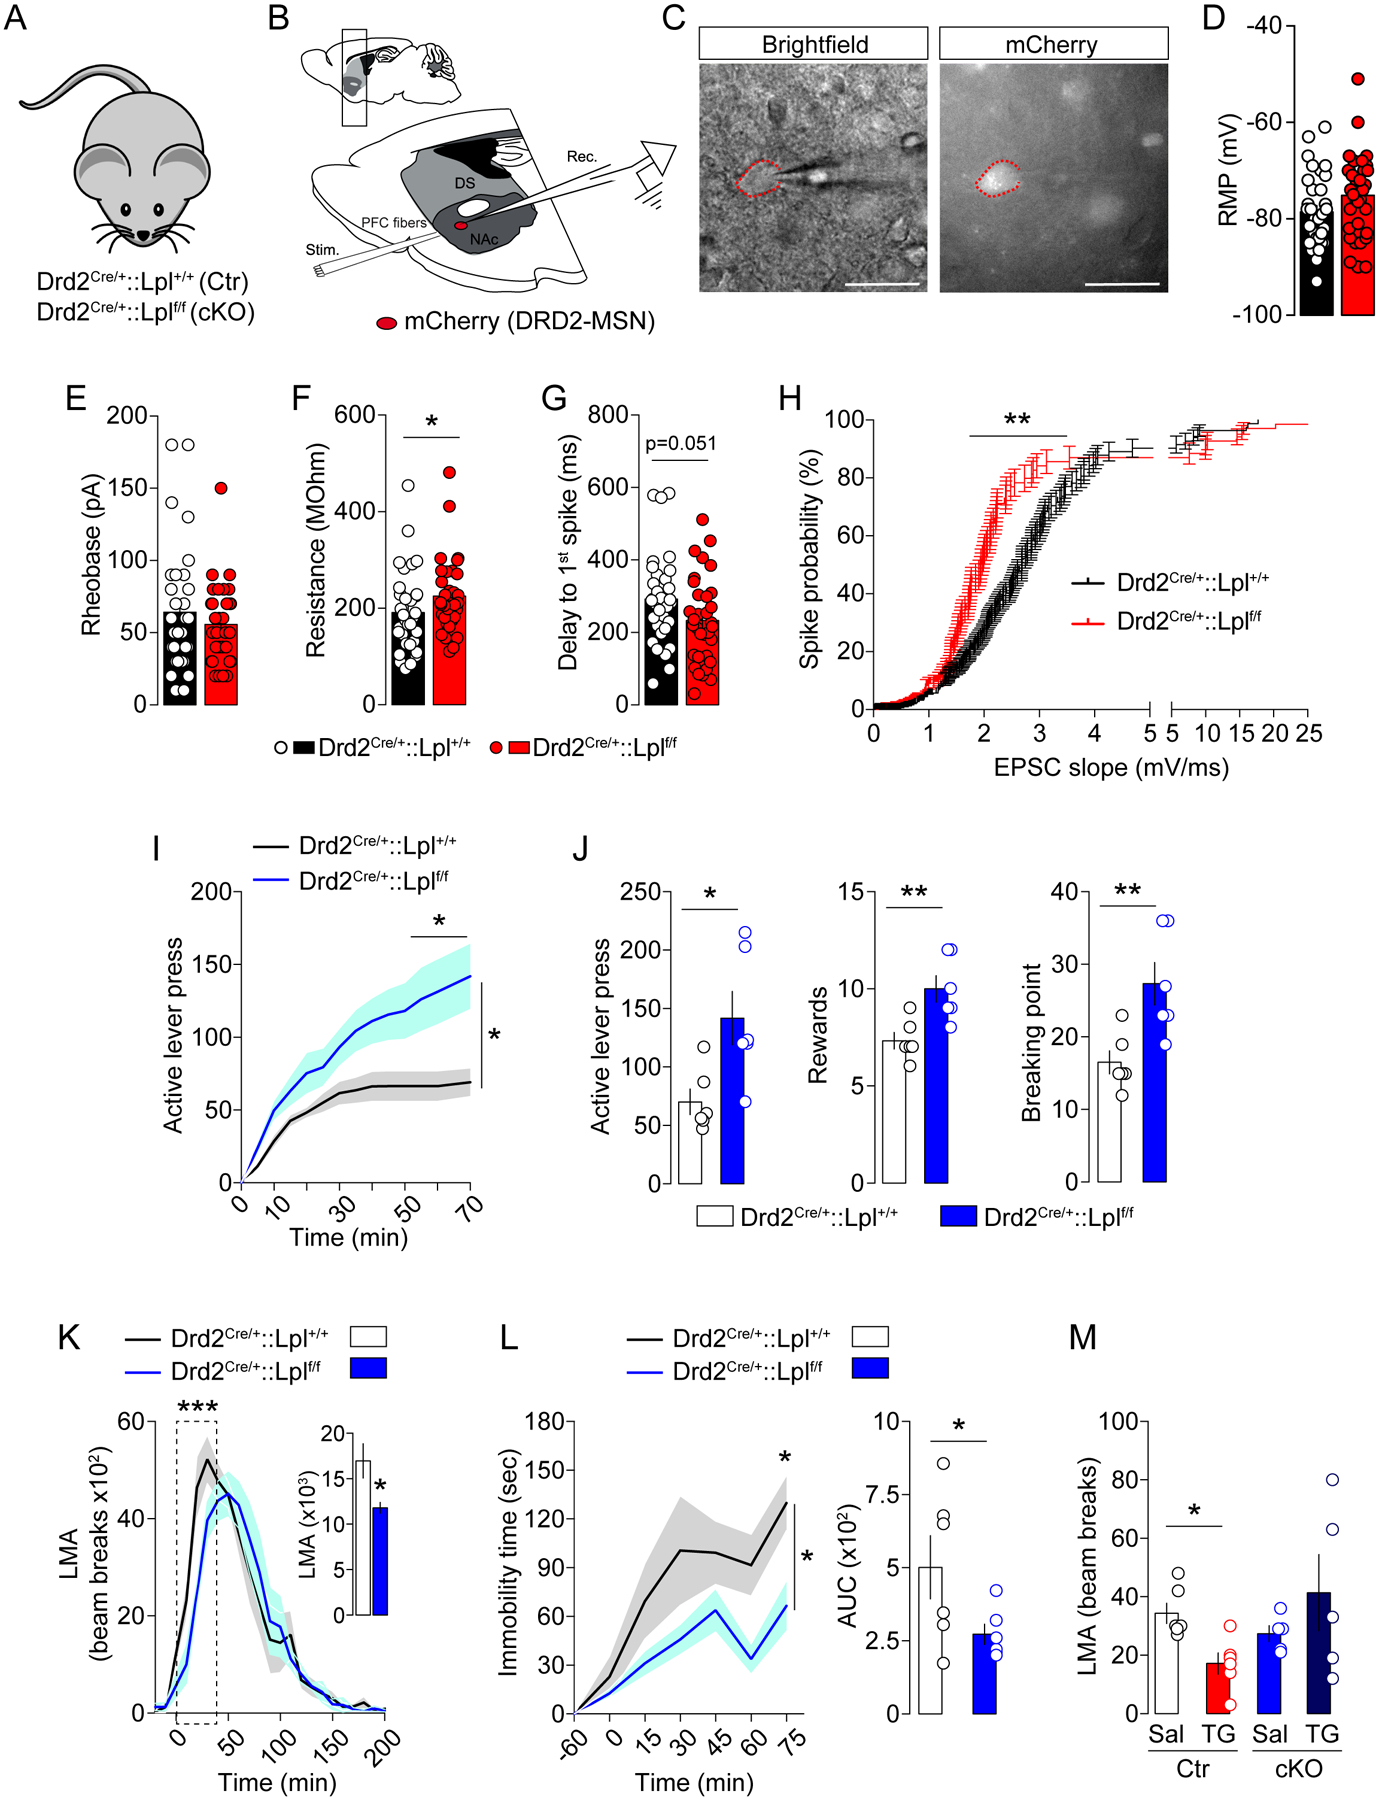
Figure 6. Lpl in DRD2-neurons controls excitability and behavioral responses to DA-associated behaviors.

(A) Genetic strategy to delete Lpl from DRD2-neurons: Drd2Cre/+::Lpl+/+ mice (control, Ctr) and Drd2Cre/+::Lplf/f mice (cKO). (B) Drawing illustrates the sagittal slice used for cortical stimulation and patch-clamp recordings in Drd2Cre/+::Lpl+/+ and Drd2Cre/+::Lplf/f transgenic mice, all injected with an AAV-hSyn-DIO-mCherry in the nucleus accumbens (NAc). (C) Representative picture of a recorded mCherry-positive accumbal DRD2-MSN. Histograms indicate the resting membrane potential (RMP in mV, D), the rheobase (in pA, E), the membrane resistance (in MOhm, F) and the delay to first spike (in ms, G) of mCherry-positive accumbal MSNs in both genotypes, Drd2Cre/+::Lpl+/+ (black) vs Drd2Cre/+::Lplf/f (red) transgenic mice. (H) Curves indicate the probability to trigger a spike (in %) in recorded mCherry-positive MSNs following increasing cortical stimulations in both genotypes. Statistics: *p<0.05 and **p<0.01 Drd2Cre/+::Lplf/f vs Drd2Cre/+::Lpl+/+ mice. (I, J) Operant conditioning performances of Drd2Cre/+::Lpl+/+ and Drd2Cre/+::Lplf/f transgenic mice during the active lever press. Statistics: *p<0.05 Drd2Cre/+::Lplf/f vs Drd2Cre/+::Lpl+/+ mice. (K) Locomotor activity (LMA) to amphetamine (3 mg/kg), (L) immobility response to the DRD2 antagonist haloperidol (0.5 mg/kg) during the catalepsy test and (M) spontaneous 6-hours locomotor activity (LMA) following central saline or TG delivery. Statistics: ***p<0.001, *p<0.05. For statistical details see Table S5.
