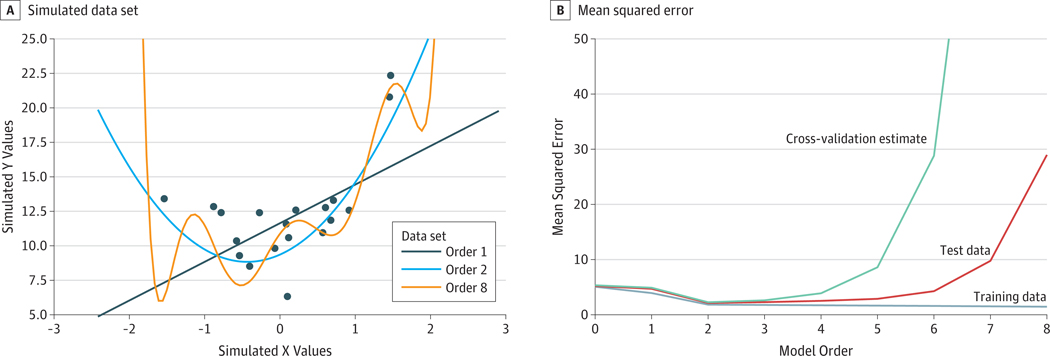
Figure 1. Depiction of Overfitting.
A, Simulated data set. The data set was generated from a quadratic model (ie, polynomial order 2). The best-fitting models are depicted: polynomial order 1 (linear), polynomial order 2 (quadratic), and polynomial order 8 (complex). The complex model overfits the data set, adapting itself to the noise evident in specific data points, with its predictions oscillating at the extremes of the x-axis. B, Mean squared error. Mean squared error for the model was assessed against the data set used to train the model and against a separate test data set sampled from the same generative process with different random measurement error. Results reflect the median over 1000 simulation runs. Order 0 indicates no model complexity, and order 8 indicates maximum model complexity. The mean squared error decreases for the training data set as the complexity of the model increases. The mean squared error estimated using 4-fold cross-validation (green) is also lowest for the true model.

