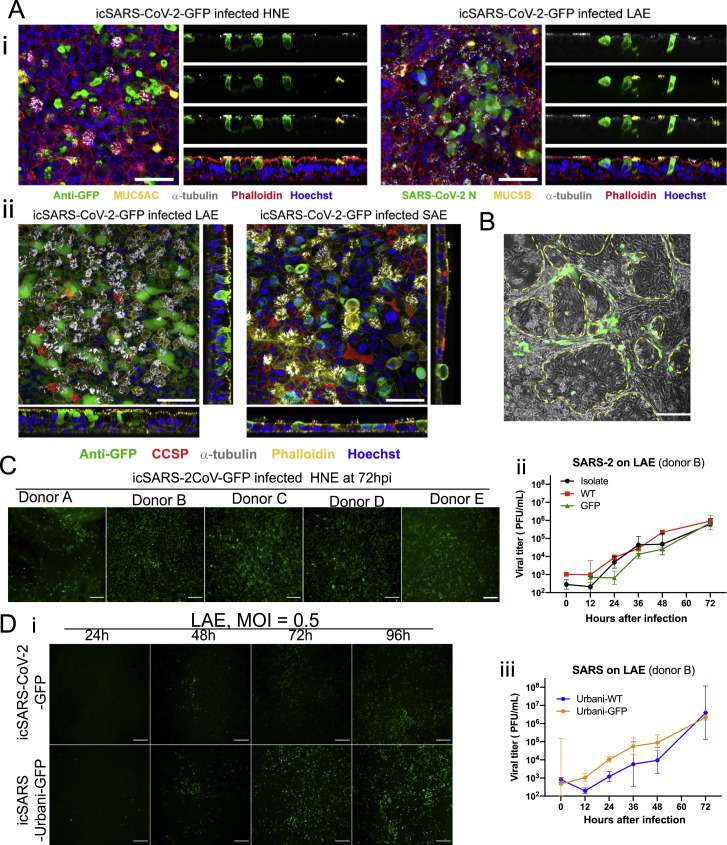
Figure S4.
Additional data of SARS-CoV and SARS-CoV-2 infected primary human cells, related to Figure 6
(A) Representative whole-mount extended focus views of icSARS-CoV-2-GFP-infected (i) HNE and LAE cell cultures. Red = filamentous actin (phalloidin), White = α-tubulin (multiciliated cells), Blue = nuclei (Hoechst 33342). Green = GFP (left). Green = SARS-CoV-2 Nucleocapsid (right). Yellow = MUC5AC (left). Yellow = MUC5B (right); (ii) LAE and SAE cell cultures. Yellow = filamentous actin (phalloidin), White = α-tubulin (multiciliated cells), Blue = nuclei (Hoechst 33342). Green = GFP (virus). Red = CCSP. Scale bars, 50 μm.
(B) Merged of GFP and bright field mages taken from AT1 and AT2 cells infected with icSARS-CoV-2-GFP at 48 h. The AT-1 cells are present inside the enclosed areas. Bar = 100 μm.
(C) GFP signals of icSARS2-GFP-infected HNEs collected from five different donors at 72 hpi, MOI = 3.
(D) (i) Fluorescent signals of the two viruses in LAE (ii) Growth curves of three SARS-CoV-2 viruses in LAE from the same donor. Scale bar, 200 μm. (iii) Growth curves of two SARS-Urbani viruses in LAE. Data are presented in mean ± SD. All the infections in this figure were in MOI = 0.5.

