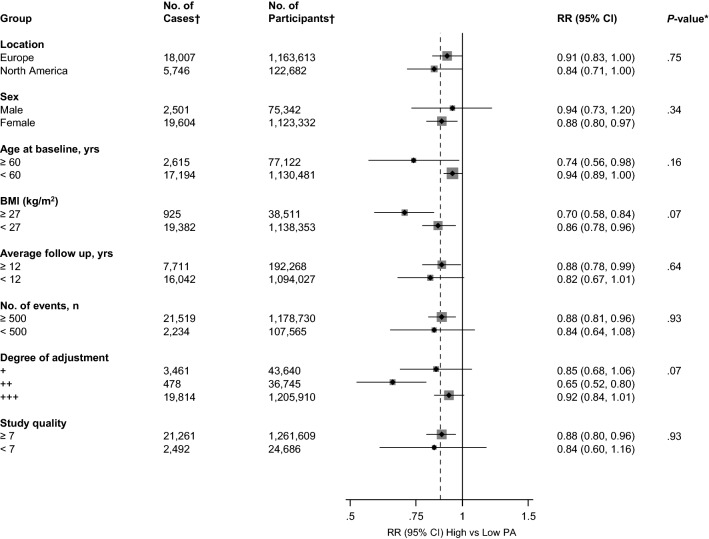
Fig. 3.
Relative risks for venous thromboembolism comparing maximal versus minimal amount of physical activity, grouped according to several study characteristics. The summary estimates presented were calculated using random effects models; CI, confidence interval (bars); PA, physical activity; RR, relative risk; VTE, venous thromboembolism; *, p value for meta-regression; **, defined as ‘+’ minimally adjusted analysis (age and/or sex); ‘++’ as adjustment for established risk factors without body mass index (age and/or sex plus cancer, socioeconomic status, smoking, or hypertension); and ‘+++’ as adjustment for established risk factors including body mass index; †, number of cases and participants are not equal across all the subgroups because not all studies reported data on these study characteristics

