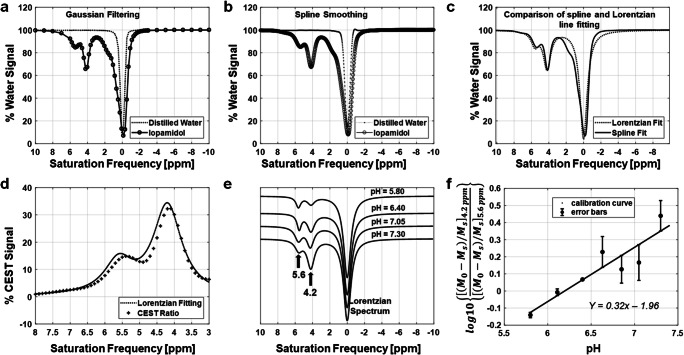
Fig. 1.
Data processing steps to obtain a pH calibration curve. a, b The percentage water signal over different saturation frequencies, obtained from chemical samples made of distilled water and iopamidol: a the Gaussian filtered signal; and b spline filtered signal. c The percentage water signal from iopamidol for Lorentzian line shapes fitted to the data in b. A spline fitted curve is also shown in c for comparison with Lorentzian fitted curve. d The percentage difference signal (CEST ratio) between distilled water and iopamidol. e The Lorentzian spectra over different pH values. f The pH calibration curve based on a log10 ratio of the two CEST signal amplitudes and the corresponding error bars.

