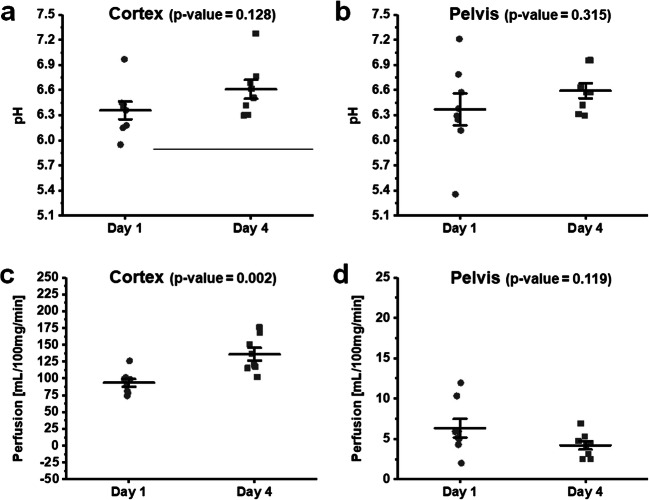
Fig. 6.
Comparisons of pH and perfusion values on day 1 and day 4 from mice which received iopamidol prior to receiving IRDye (MRI first). The pH in a cortex and b pelvis, and perfusion in c cortex and d pelvis, respectively. Each data point represents an individual kidney. Error bars represent the standard error.

