Figure 2.
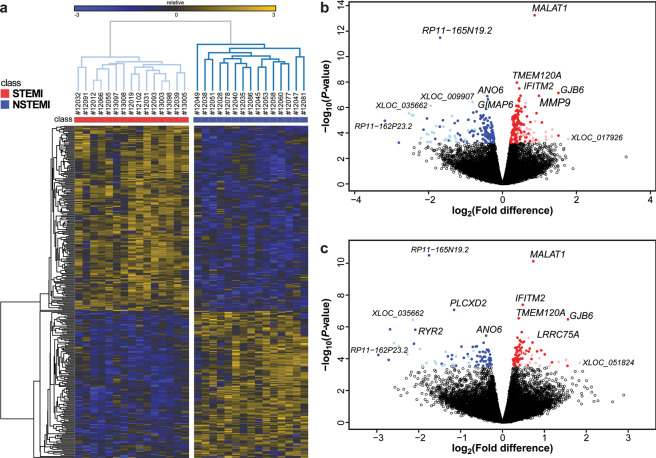
Differential gene expression in STEMI vs. NSTEMI matched patients. Statistical analysis was performed by negative binomial Generalized Linear Model, controlling for multiple testing using the false discovery rate (FDR) by the Benjamini-Hochberg procedure. (a) Heatmap depicting relative expression abundance of differentially expressed (DE) genes (FDR-adjusted P < 0.05) in STEMI (n = 15) vs. NSTEMI (n = 15) patients, matched for age, sex, and cardiovascular risk factors. Unsupervised average-linkage hierarchical clustering based on Spearman dissimilarity matrix allowed complete separation between STEMI and NSTEMI, suggesting that these 323 DE genes strongly associated with the specific AMI phenotype. Gene expression levels were expressed as log2 transformed normalized counts and displayed as gradient colours from higher (dark orange) to lower (dark blue). (b) Volcano plot depicting log2 mean fold-differences (STEMI vs. NSTEMI, n = 15 for both groups, x-axis) versus −log10 P-values (y-axis) of all genes, stemming from the differential analysis not corrected for the level of cardiac troponin I (cTnI) on admission. Significant DE genes are coloured: 151 annotated (red dots) and 29 unannotated (pink) genes were over-expressed in STEMI, whereas 113 annotated (blue dots) and 30 unannotated (light blue) genes in NSTEMI. (c) Volcano plot showing results of differential expression analysis in the same patient groups after correction for admission cTnI. Among the 153 DE genes standing the correction (FDR < 0.05), 64 annotated and 14 unannotated genes were over-expressed in STEMI and 57 annotated and 18 unannotated genes in NSTEMI. The average expression levels, the mean fold-differences, and the significance levels of all genes detected in STEMI (n = 15) vs. NSTEMI (n = 15) patients’ peripheral blood, for both the uncorrected and the cTnI-corrected models, are given in Supplementary Table S1.

