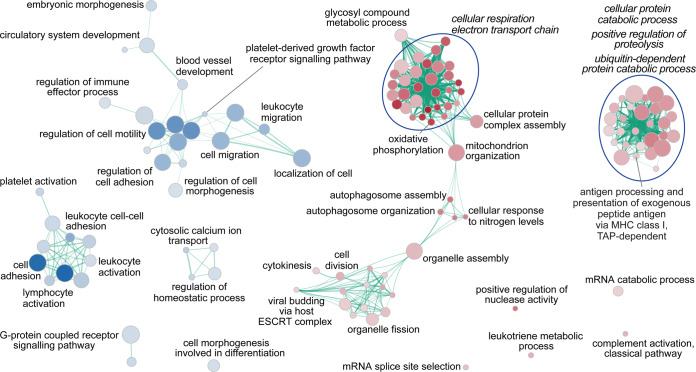
Figure 3.
Enrichment map of gene-sets stemming from the analysis on the cTnI-corrected dataset. Functional enrichment investigation on genome-wide expression profiles was done by Gene Set Enrichment Analysis (GSEA), using as gene ranking metric the likelihood ratio statistics of the differential expression analysis performed by GLM, correcting for cTnI on admission, in STEMI (n = 15) vs. NSTEMI (n = 15) patients matched for age, sex, and cardiovascular risk factors. To visually interpreting GSEA results, a network of the most significant Gene Ontology biological processes (GO-BP; at an FDR-adjusted P < 0.05) was drawn. The node colour associates with STEMI (red) or NSTEMI (blue) phenotype; node gradient colour is proportional to node significance, from lower (light) to higher (dark); node size is proportional to the gene-set size. Edge thickness is proportional to the similarity between two gene-sets, for a cut-off of 0.25 of the combined Jaccard plus Overlap coefficient. An extended list of GO-BP gene-sets significant at a nominal P-value < 0.05, along with enrichment statistics, is given in Supplementary Table S2a.

