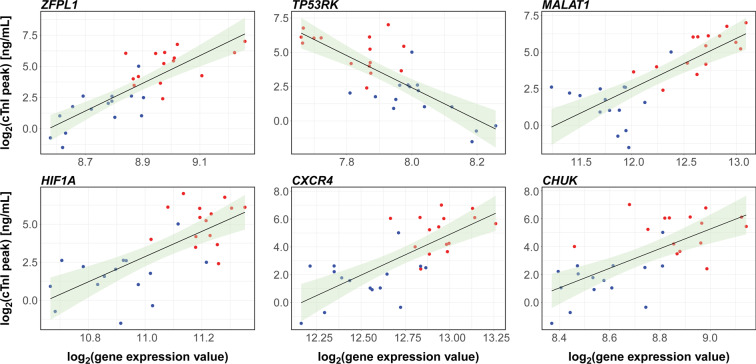
Figure 5.
Genes predicting the cTnI peak. Linear regression was used to model the relationship between peak cTnI level (as the outcome variable) and peripheral blood gene expression on hospital admission (explanatory variable). Scatter plots and trendlines show six of the most significant genes that positively or negatively correlate with cTnI peak (see Table 2 for statistics). The full list of genes significantly predicting cTnI peak at an FDR-adjusted P-value < 0.05, along with the coefficients of determination R2, the regression β coefficients, and the exact P-values, in either the uncorrected or the cTnI-corrected models, is given in Supplementary Table S3. STEMI (n = 15) and NSTEMI (n = 15) samples are highlighted by red and blue dots, respectively. The 95% confidence interval of the trendline is depicted in light green.

