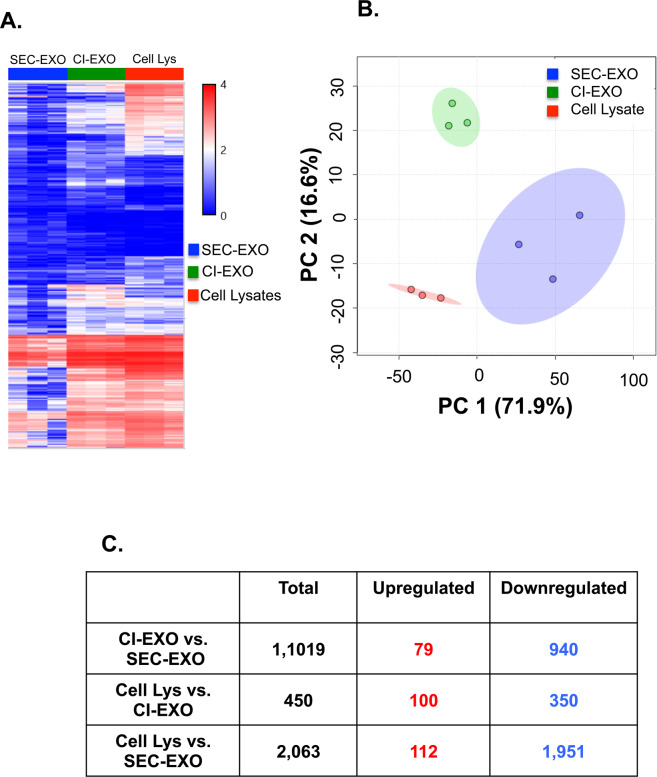
Figure 2.
Exosome miRNA Profiling. miRNA from CI- and SEC-exosomes and OVCAR-3 cell lysates (serving as a control) were collected and analyzed. (A) Hierarchical clustering analysis and (B) PCA mapping were performed for CI-exosome, SEC-exosome, and cell lysate samples. For the PCA plot (cell lysates—red, CI-exosome—green, and SEC-exosome—blue), each point represents a biological sample, the x-axis represents first principal component, and the y-axis represents second principal component. In our miRNA data, the first two principal components account for 71.9% and 16.6% of the total variability in miRNA expression, respectively. The first two principal components explain 88.5% of the variance. The observed principal components consequently led to separate groups between exosomes and cell lysates. (C) Table representing the number of miRNAs that are differentially upregulated and downregulated between population of exosomes and cell lysates.

