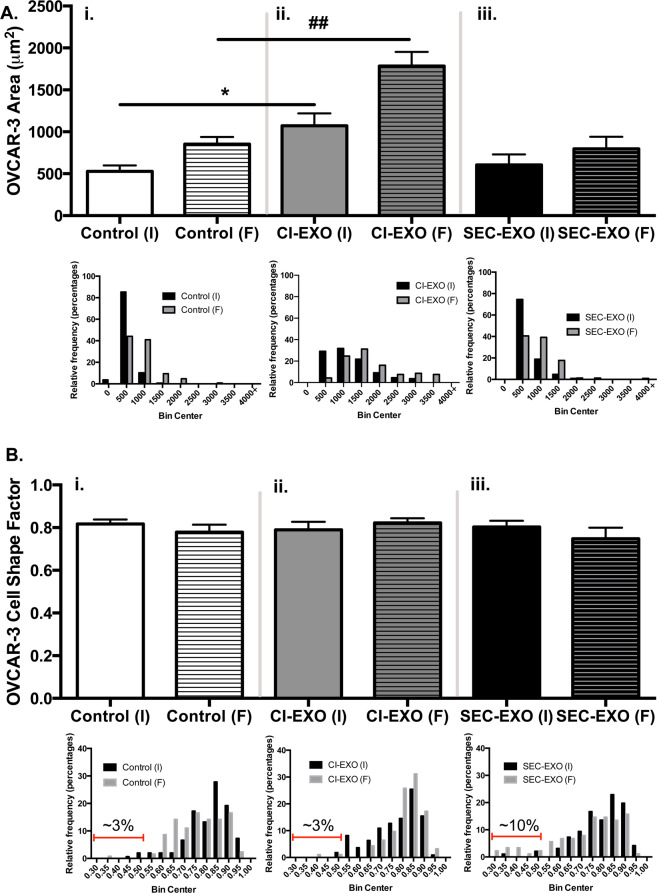
Figure 7.
Exosome Treatment in a Coculture System Leads to Differences in Cancer Cell Morphology and Area. Equal number of CAFs and OVCAR-3 were seeded on surfaces and were treated with or without exosomes. Images of coculture model were taken every 30 minutes over a 16-hour period. (A) OVCAR-3 area average and distribution were measured at initial (I) and final (F) time points using ImageJ (N = 3). (ii) CI-exosome treatment significantly increased OVCAR-3 spread area compared to (i) untreated spread areas at respective I and F time points. (iii) SEC-exosome treatment did not show any statistically significant change in spread area. (B) Average shape factor results show no statistical difference between (ii-iii) exosome treatment and (i) untreated groups at either initial (I) or final (F) time points. Interestingly, histogram distributions showed that (iii) SEC-exosomes led to a small percentage of elongated outlier OVCAR-3 cells at final time points (black) compared to initial points (gray). The highlighted red-gated region in (i-iii) represents OVCAR-3 that had shape factors less than 0.5. Specifically, we quantified that SEC-exosomes induced elongation in approximately 10% of OVCAR-3. Untreated and CI-exosomes induced elongation in approximately 3% of OVCAR-3. Statistics calculated using Student’s t-test and reported as values +/− SEM. *p < 0.05, ##p < 0.005.

