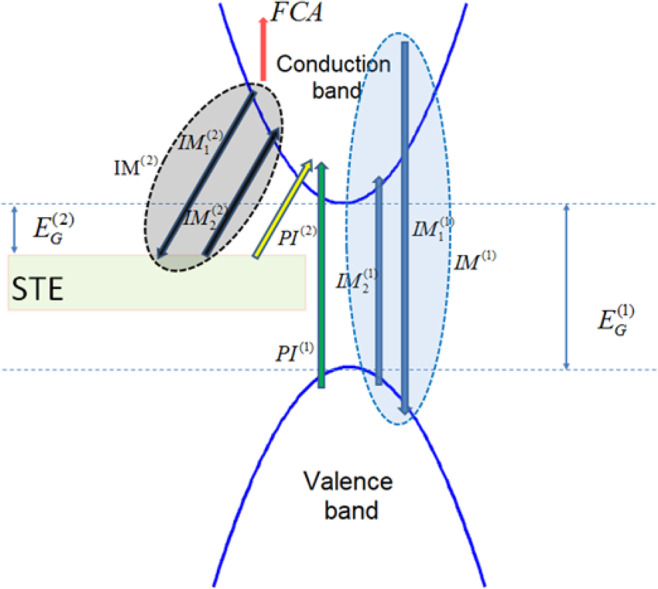
Figure 1.

Excitation processes in fused silica: Green and yellow arrows indicate photoionisation mechanism (PI(1) and PI(2)) from VB and self-trapped exciton (STE) levels, respectively. The position of the STE ‘box’ simply illustrates graphically that the STE band lies between VB and CB. Blue region corresponds to the impact ionisation process IM(1) from CB to VB [blue down arrow indicates collision of highly energetic electrons in CB with electrons in VB while blue up arrow indicates transfer of the latter into CB ]. Similarly, gray region corresponds to the impact ionisation ( from CB to STE [black down arrow indicates collision of highly energetic electrons in CB with electrons in STE while black up arrow indicates transfer of the latter into the CB)]. (or ) stand for the band gaps between top of VB (or STE) and bottom of CB. Red arrow corresponds to inverse bremsstrahlung (free carrier absorption, FCA).
