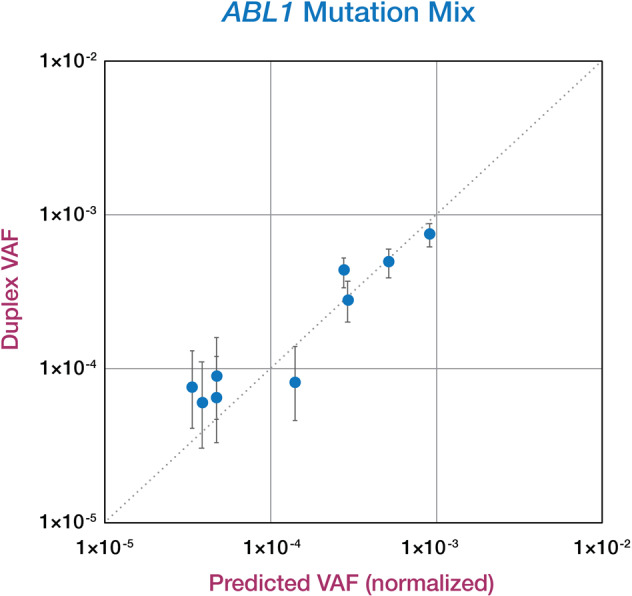
Fig. 2. Association of predicted vs. detected ABL1 mutation VAFs.

Predicted VAF (x-axis) was calculated by multiplying the original sample VAF by the dilution factor. To account for differences in performance due to varying DNA quality of individual samples in the mix, predicted VAFs were normalized to mean Duplex depth of individual samples vs. the negative control DNA preparations. The y-axis represents observed Duplex VAF of each mutation in the mix. Error bars represent Wilson 95% confidence intervals. r2 for observed vs. expected VAF = 0.93.
