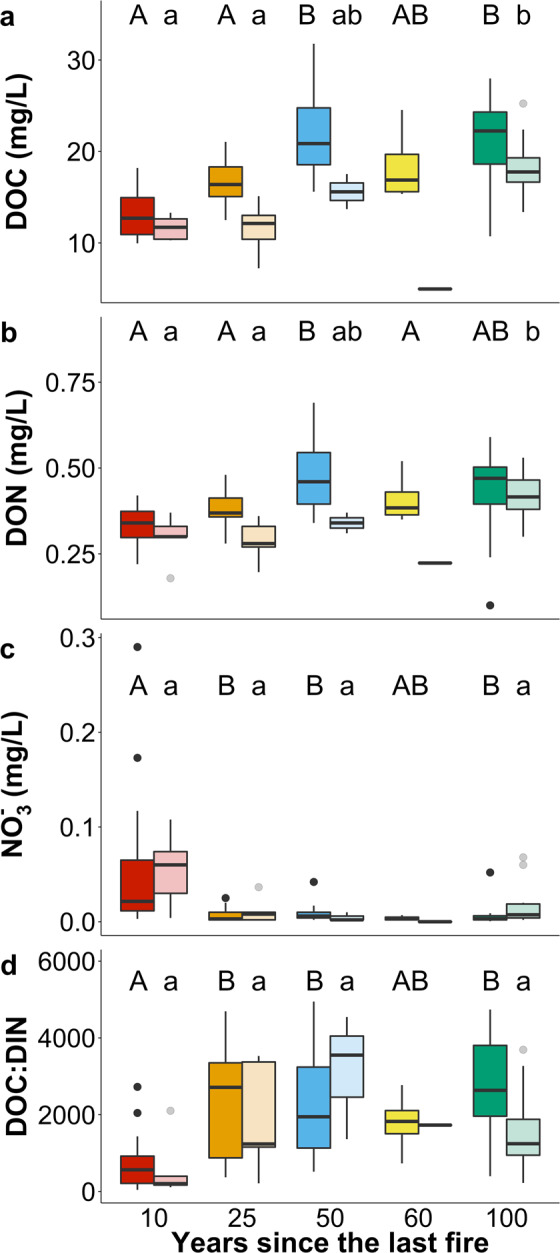
Figure 2.

DOM, nutrient concentrations, and stoichiometric ratios across the burn gradient. Boxplot panels represent (A) DOC, (B) DON, (C) NO3–N concentrations, and (D) molar DOC:DIN ratios, across 17 streams sampled 2011, 2013, and 2016–2017 during June and July across the burn gradient. The paired boxplots correspond to June (dark shade) and July (lighter shade). Boxes represent interquartile range with the median value as the bold line, whiskers represent 1.5 interquartile range, and points are possible outliers. Letters denote significant differences (α = 0.05) where uppercase correspond to June and lowercase to July. Note that July data in 60 years since the last fire was excluded from statistical analysis due to low n. Significant differences were tested using ANOVA for the parametric variables and Kruskal-Wallis test for nonparametric variables. Statistics for DOC June p = 1.8 × 10⁻⁸ and July p = 8.3 × 10⁻⁴; DON June p = 0.0002 and July p = 0.005; DIN June p = 0.008 and July p = 0.04; DOC:DIN June p = 0.0008 and July p = 0.06. Respective n-values across the burn gradient for June: 16, 16,19, 4, 10; July: 5, 5, 3, 1, 10.
