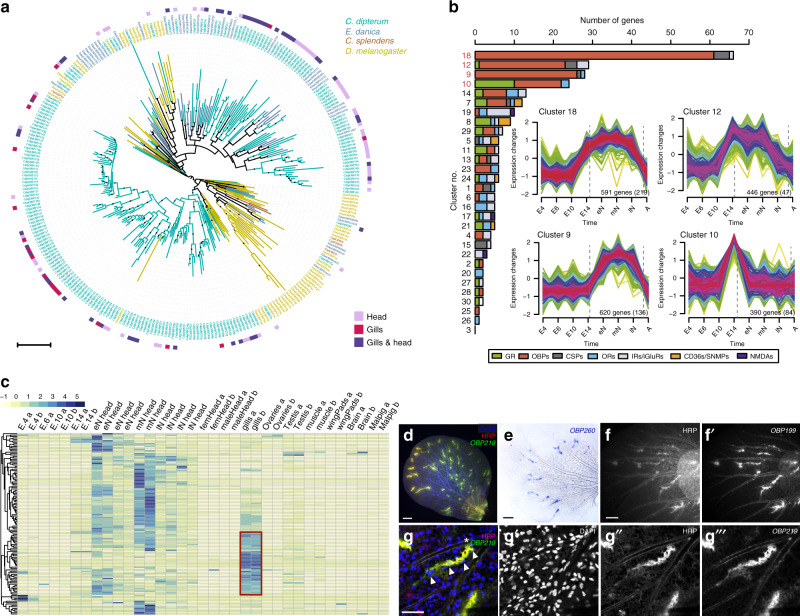
Fig. 3. OBP gene family in C. dipterum.
a OBP phylogenetic reconstruction. C. dipterum genes are shown in green, E. danica in blue, C. splendens in brown and D. melanogaster in mustard. OBPs expressed specifically (according to tau values > 0.8; Supplementary Data 11) in nymphal heads are highlighted by pink squares, in gills in magenta and OBPs expressed both in heads and gills are shown in purple. b C. dipterum chemosensory families distributed across Mfuzz clusters. Clusters containing the largest amounts of chemoreceptors are no. 18, 12, 9 and 10 (E4: 4 dpf embryo, E6: 6 dpf embryo, E10: 10 dpf embryo, E14: 14 dpf embryo, eN: early nymph head, mN: mid nymph head, lN: late nymph head, A: adult head). Numbers in plots show the genes, and between parentheses, core genes for each cluster. c Heat map showing high levels of OBP expression across RNA-seq samples. Increased expression in nymphal head samples. An important fraction of OBP genes are highly expressed in gills (red square). d Spatial expression of OBP219 (green) in neural structures, marked by HRP staining (in red) in abdominal gills. e Spatial expression of OBP260 in abdominal gills. f–f′, OBP199 expression pattern in the gills (f′) co-localises with HRP-stained neural cells. g Detail of a cluster of cells expressing OBP219 (g″′) and marked by HRP (g″) in close contact with a trachea (highlighted by white asterisk). Nuclei are detected by 4′,6-diamidino-2-phenylindole (DAPI) staining (white arrowheads). Scale bars: 50 μm. Spatial expression of OBP genes (d–g″′) was assayed in at least two independent experiments with n > 20 gills each.

