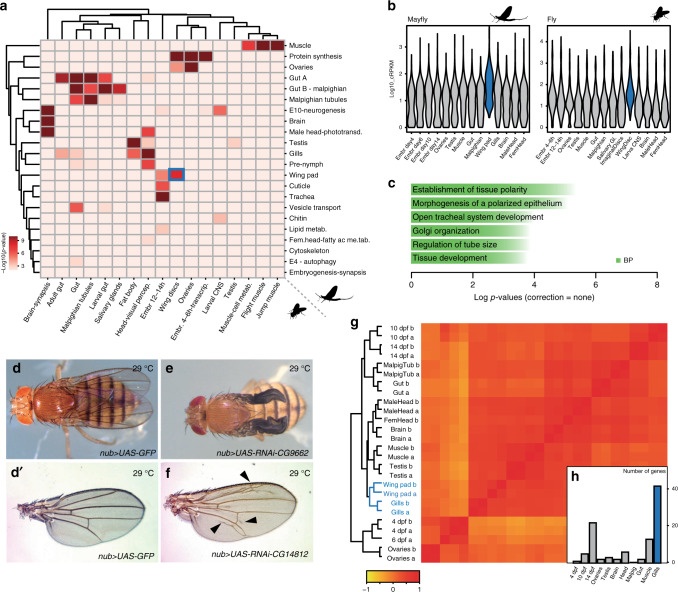
Fig. 5. Transcriptomic conservation of wings and other insect tissues.
a Heatmap showing the level of raw statistical significance, using upper-tail hypergeometric tests, of orthologous gene overlap between modules from C. dipterum (vertical) and Drosophila (horizontal) obtained by Weighted Gene Correlation Network Analysis (WGCNA). b Gene expression distributions (log10 cRPKMs) within the wing modules across each sample (a) for C. dipterum (left) and D. melanogaster (right). c Enriched Gene Ontology terms (BP: biological process) of the orthologous genes shared between C. dipterum and D. melanogaster wing and wing disc modules, using the wing disc module of D. melanogaster as background. d–f Wing phenotypes resulted from knockdowns of orthologous genes shared between C. dipterum and D. melanogaster wing and wing disc modules using wing-specific driver nub-Gal4. d, d′ nub-Gal4; UAS-GFP control fly (d) and control wing (d′). e nub-Gal4; UAS-RNAi-CG9662 flies show severe wing phenotypes. f nub-Gal4; UAS-RNAi-CG14812 show extra vein tissue phenotypes. g Heat map showing transcriptome datasets clustering. C. dipterum wing pads and gills samples cluster together. h Number of genes per each of second most tissues for 98 genes highly expressed in wing pads (n = 98). Gills are highlighted in blue.

