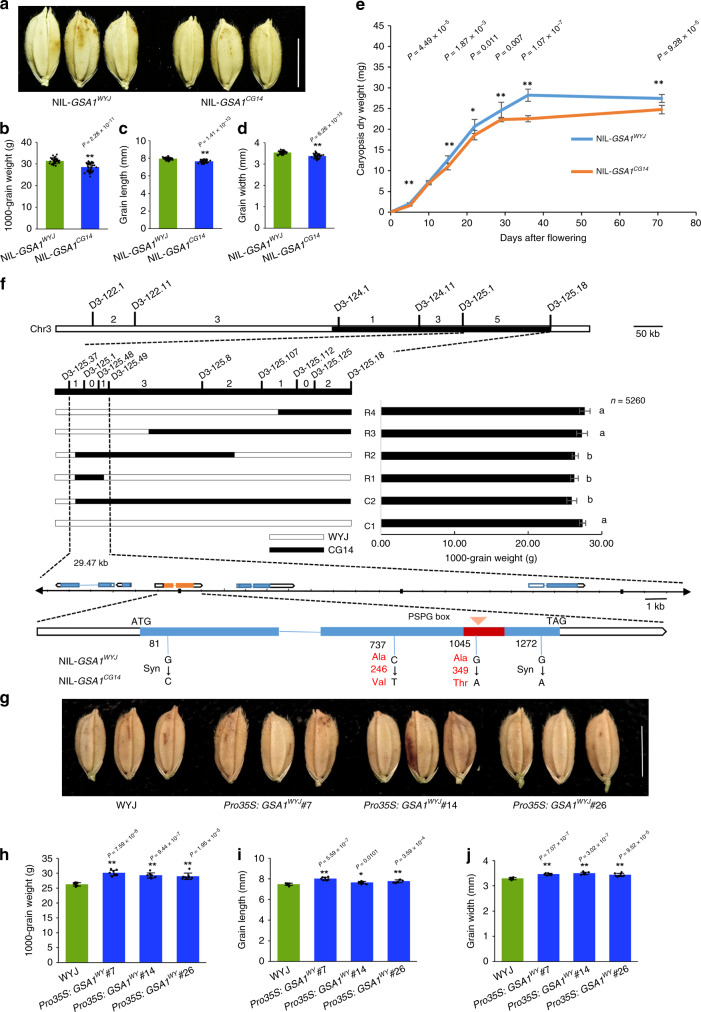
Fig. 1. Map-based Cloning of GSA1.
a Mature grains of NIL-GSA1WYJ and NIL-GSA1CG14. Scale bar = 5 mm. Comparison of 1000-grain weight (b), grain length (c) and grain width (d) between NIL-GSA1WYJ and NIL-GSA1CG14 (n = 40 plants). e Time-course of the change in caryopsis dry weight for NIL-GSA1WYJ and NIL-GSA1CG14 (n = 8 plants, 40 caryopses per plant). f GSA1 was initially mapped to the interval between the markers D3-125.1 and D3-125.18 on long arm of chromosome 3 and then narrowed to a 29.47 kb region containing five genes. The numbers of recombinant individuals are shown between the marker positions. 1000-grain weight is shown to the right of the schematic for each representative recombinant line. Recombinant lines R2, R3, and R4 originated from recombinant line C2; recombinant line R1 originated from recombinant line R2. Values represent the mean ± s.d. (n = 20 plants). Different letters indicate significant differences (P < 0.05) determined by Duncan’s multiple range test. Single nucleotide mutations and the corresponding amino acid changes in NIL-GSA1CG14 are shown beneath the schematic illustration of the GSA1 gene. Syn, synonymous variations. The red box indicates the PSPG domain. g Mature grains of WYJ and the overexpression lines Pro35S: GSA1WYJ#7, Pro35S:GSA1WYJ#14 and Pro35S:GSA1WYJ#26. Scale bar = 5 mm. Comparison of 1000-grain weight (h), grain length (i) and grain width (j) between WYJ and the overexpression lines (n = 8 plants). The values in b–e and h–j represent the mean ± s.d. *P < 0.05 and **P < 0.01 indicate significant differences compared with NIL-GSA1WYJ or WYJ in two-tailed Student’s t tests. The source data underlying Fig. 1b–f and h–j are provided as Source Data file.

