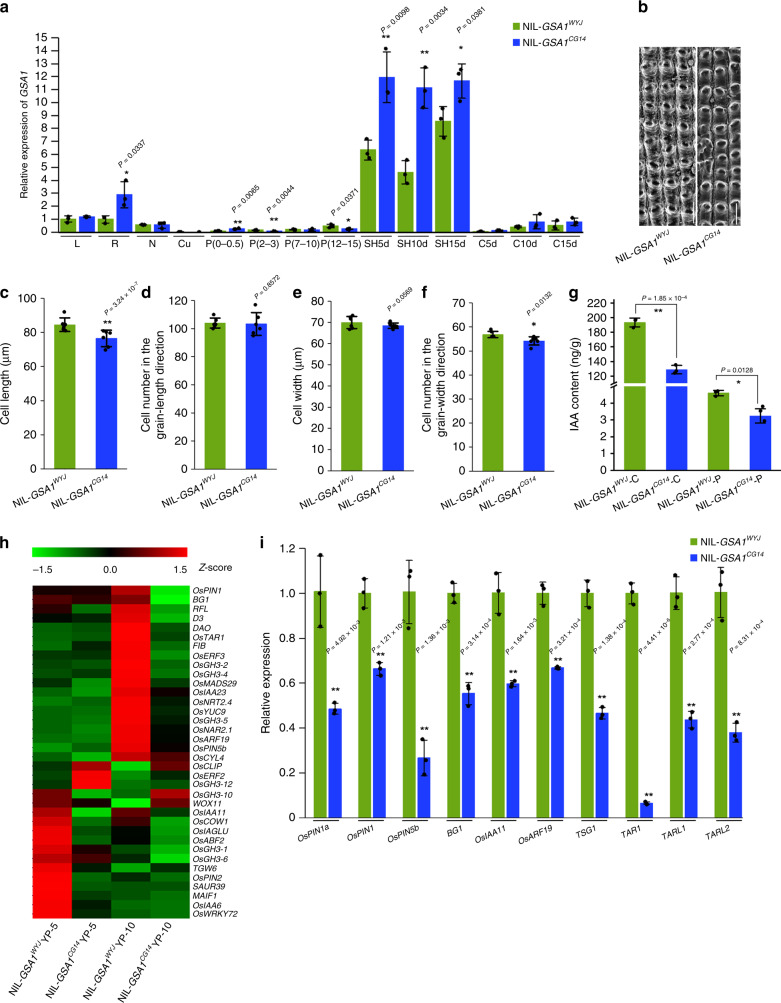
Fig. 2. GSA1 controls spikelet size by influencing cell proliferation and cell expansion.
a The relative expression levels of GSA1 in NIL-GSA1WYJ and NIL-GSA1CG14 leaves (L), roots (R), culm nodes (N), culms (Cu), young panicles (P, numbers in brackets indicate the length of young panicles, cm), spikelet hulls (SH) and caryopses (C) determined by qRT-PCR (n = 3 biological replicates). 5 d, 10 d, and 15 d indicate 5 days, 10 days and 15 days after flowering, respectively. The actin gene was used for normalization. b Scanning electron micrographs of the outer epidermal cells of NIL-GSA1WYJ and NIL-GSA1CG14 spikelet hulls at the mature stage. Scale bar, 100 μm. Comparison of the outer epidermal cell length (c), cell number in the grain-length direction (d), cell width (e) and cell number in the grain-width direction (f) of spikelet hulls between NIL-GSA1WYJ and NIL-GSA1CG14 (n = 6 grains). g Comparison of the endogenous IAA levels in young caryopses (C, 10 days after flowering) and young panicles (P, ~10 cm) at the booting stage between NIL-GSA1WYJ and NIL-GSA1CG14 (n = 3 biological replicates). h Clustering heat maps of the relative expression levels of auxin-related genes in young panicles (YP) of NIL-GS3.2WYJ and NIL-GS3.2CG14 determined using RNA-seq data. YP-5, 5 cm young panicles. YP-10, 10 cm young panicles. Standard-scores (Z-scores) were used as the numerical signs to evaluate the standard deviations from the mean of the corresponding samples. i The relative expression levels of auxin-related genes in young panicles (~10 cm) of NIL-GSA1WYJ and NIL-GSA1CG14 determined by qRT-PCR (n = 3 biological replicates). The values in a, c–g, and i represent the mean ± s.d. *P < 0.05 and **P < 0.01 indicate significant differences compared with NIL-GSA1WYJ in two-tailed Student’s t tests. The ubiquitin gene was used for normalization. The source data underlying Fig. 2a and c–i are provided as Source Data file.

