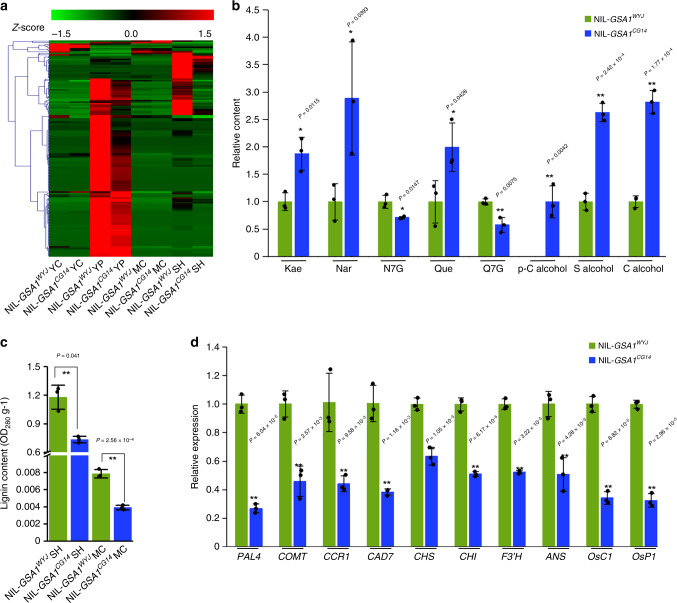
Fig. 3. Altered flavonoid glycoside profiles and phenylpropanoid pathway in NIL-GSA1CG14.
a Clustering heat maps of the relative levels of flavonoid glycosides in young caryopses (YC, 10 days after flowering), young panicles (YP, ~10 cm) at the booting stage, mature caryopses (MC) and mature spikelet hulls (SH) of NIL-GSA1WYJ and NIL-GSA1CG14 (n = 3 biological replicates) from widely targeted metabolomics data. Standard-scores (Z-scores) were used as the numerical signs to evaluate the standard deviations from the mean of the corresponding samples. b Relative levels of flavonoids and flavonoid glycosides (Kae, Nar, N7G, Que, Q7G) in young panicles and monolignol (p-C alcohol, S alcohol, C alcohol) in young caryopses of NIL-GSA1WYJ and NIL-GSA1CG14 (n = 3 biological replicates). Kae, kaempferol. Nar, naringenin. N7G, naringenin-7-O-glucoside. Que, quercetin. Q7G, quercetin-7-O-glucoside. p-C alcohol, p-coumaryl alcohol. S alcohol, sinapyl alcohol. C alcohol, coniferyl alcohol. c The lignin content of mature spikelet hulls (SH) and mature caryopses (MC) of NIL-GSA1WYJ and NIL-GSA1CG14 (n = 3 biological replicates, 5 plants per replicate). d The relative expression levels of genes involved in the general phenylpropanoid pathway (PAL4, COMT), the lignin specific pathway (CCR1, CAD7), flavonoid biosynthesis (CHS, CHI, F3’H) and anthocyanin biosynthesis (ANS, OsC1, OsP1) determined by qRT-PCR in young panicles (10 cm) of NIL-GSA1WYJ and NIL-GSA1CG14 at the booting stage (n = 3 biological replicates). The ubiquitin gene was used for normalization. The values in b–d represent the mean ± s.d. *P < 0.05 and **P < 0.01 indicate significant differences compared with NIL-GSA1WYJ in two-tailed Student’s t tests. Source data are provided as Source Data file.

