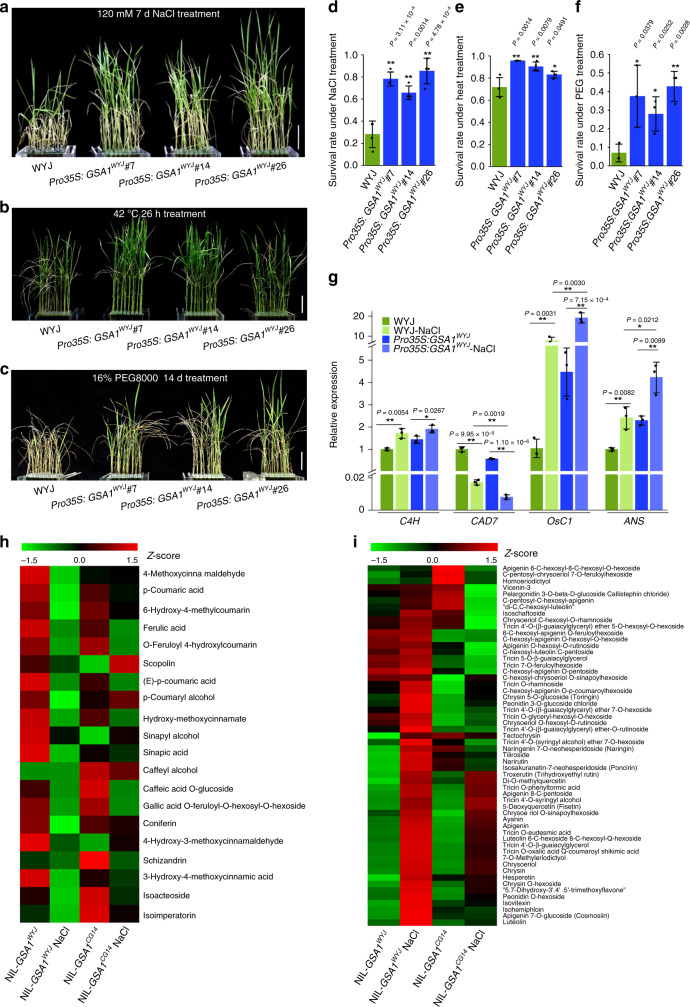
Fig. 5. GSA1 regulates abiotic stress tolerance associated with the redirection of metabolic flux.
Fourteen-day-old seedlings of WYJ and overexpression lines were transferred to 120 mM NaCl for 7 days (a), 42 °C for 26 h (b) or 16% PEG8000 for 14 days (c) and recovered for 14 days. Scale bar = 5 cm. Relative survival rates of 14-day-old seedlings of WYJ and overexpression lines after NaCl treatment (d, n = 4 biological replicates), heat treatment (e, n = 4 biological replicates) and PEG treatment (f, n = 3 biological replicates). d–f 24 plants per biological replicate. g The relative expression levels of OsC4H, OsCAD7, OsC1 and OsANS determined by qRT-PCR before and after NaCl treatment in WYJ and Pro35S:GSA1WYJ seedlings (n = 3 biological replicates). The ubiquitin gene was used for normalization. The values in d–g represent the mean ± s.d. *P < 0.05 and **P < 0.01 indicate significant differences compared with WYJ or NIL-GSA1WYJ in two-tailed Student’s t tests. h, i Clustering heat maps of the relative levels of phenylpropanoid (h) and flavonoids (i) after NaCl treatment in NIL-GSA1WYJ and NIL-GSA1CG14 seedlings (n = 3 biological replicates) determined from widely targeted metabolomics data. Standard-scores (Z-scores) were used as the numerical signs to evaluate the standard deviations from the mean of the corresponding samples. The source data underlying Fig. 5d–i is provided as Source Data file.

