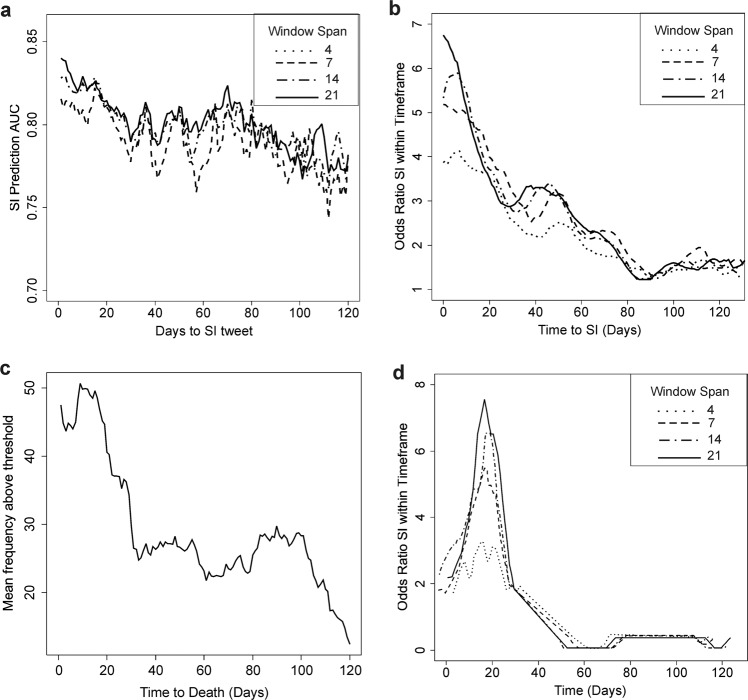
Fig. 3. Temporal prediction of suicide risk.
a A plot depicting the AUC of SI event prediction (y axis) as a function of the starting time from which tweet data was processed (x axis) for average model score data deriving from 4, 7, 14, and 21 days. b A plot depicting the OR that an SI event will occur (y axis) as a function of the starting time from which tweet data was processed (x axis) for frequency scores above each individual’s person specific threshold deriving from 4, 7, 14, and 21 days window analysis. c A plot depicting the mean frequency score per individual in N = 8 suicide decedents using a 21 day window span (y axis) as a function of time in days from death by suicide (x axis). d A plot depicting the OR of death by suicide (y axis) as a function of the starting time from which tweet data was processed (x axis) for frequency scores above each individual’s person specific threshold in N = 8 suicide decedents deriving from 4, 7, 14, and 21 days window analysis. Only significant logistic model data below a p value of 0.05 are depicted.

