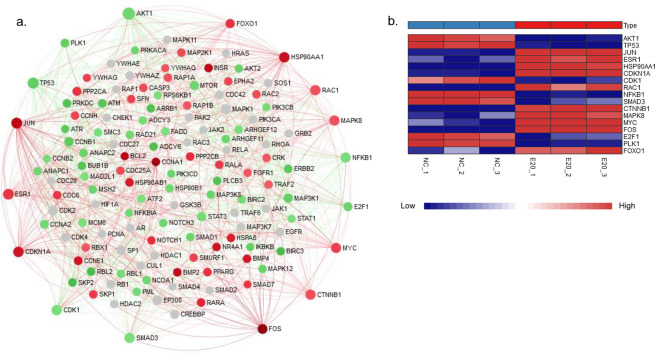
Figure 5.
Protein-protein interaction (PPI) network of differentially expressed genes (DEGs) induced by GaAs in 16HBE cells. The PPI network was drawn using the NetworkAnalyst platform based on the STRING interactome. (a) The red circles represent upregulated genes, the green circles represent downregulated genes, and the grey circles indicate no DEGs. The top degree (>20) involved in the interaction network was screened; (b) The heatmap shows the expression level of the 17 key genes in the RNA-seq data.

