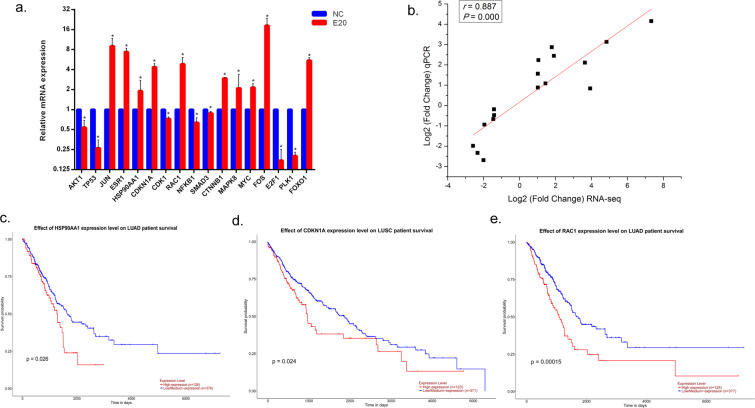
Figure 6.
qRT-PCR verification and survival curve analysis. (a) Gene expression by qRT-PCR analysis. The fold changes were calculated by using the 2−ΔΔCt method comparing the GaAs-treated group to the NC group. Data are expressed as the means ± S.D. from 3 biological repeats and 3 technical repeats. *P < 0.05 compared to control groups by Mann-Whitney test. (b) The potential correlation between the expression of dysregulated genes from RNA-seq and qRT-PCR verification was analysed using Spearman’s rank test. A P value less than 0.05 was considered statistically significant. (c) TCGA data from UALCAN demonstrated that high expression of HSP90AA1 predicted a significantly poor prognosis of lung adenocarcinoma (LUAD) patients (P < 0.05); (d) TCGA data from UALCAN demonstrated that high expression of RAC1 predicted a significantly poor prognosis of lung squamous cell carcinoma (LUSC) patients (P < 0.05); (e) TCGA data from UALCAN demonstrated that high expression of CDKN1A predicted a significantly poor prognosis of LUAD patients (P < 0.05).

