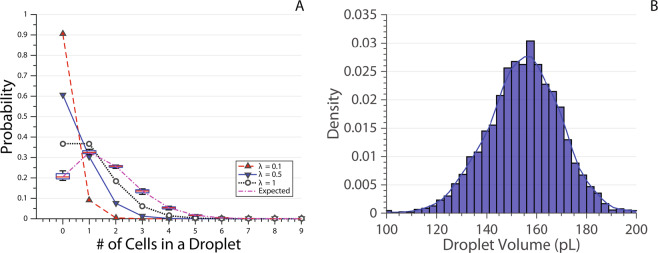
Figure 3.
(A) Probability of the number of cells in a droplet calculated for λ = 0.1 (red up triangle), 0.5 (blue down triangle) and 1 (white circle). Box plot of expected probability values calculated for each experiment using experiment specific red blood cell concentration (CC) and mean droplet volume (V) in Eq. 5. CC is calculated before the experiment by a haemocytometer, V is calculated after the experiment by averaging the volume of all droplets. The box plot is denoted ‘Expected’ values because the real CC value would be less due to cell sedimentation. The lines are joining data points for visual purposes. MATLAB’s default box plot is used, the red line shows the median, and the box denotes the 25th and 75th percentiles. The error bars (whiskers) extend to cover all data points. (B) Droplet volume recorded across different experiments carried out on multiple chips.

