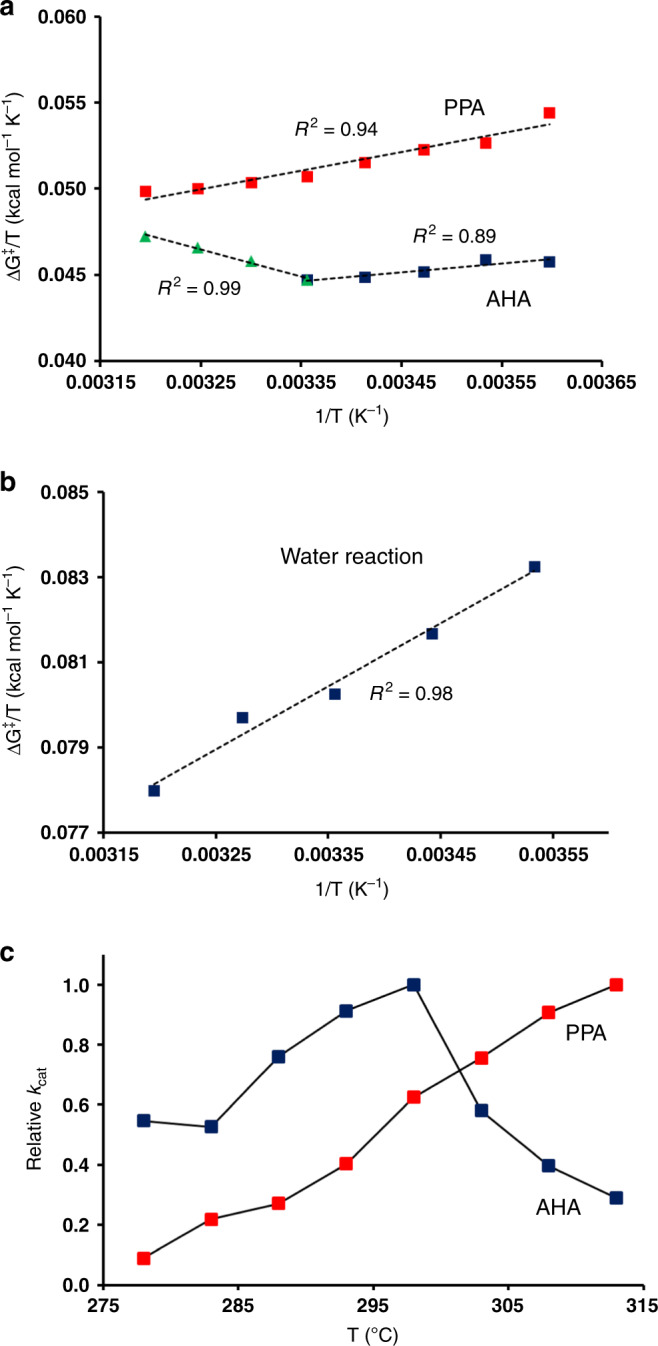
Fig. 3. Temperature dependence of the glycosylation reaction.

Arrhenius plots of ΔG‡/T vs. 1/T for the catalyzed reactions in (a) AHA and PPA and (b) for the reference reaction in water. Linear regression fits from which thermodynamic parameters are calculated are denoted by dashed lines. c Calculated temperature dependence of the relative rate constants kcat for AHA (blue) and PPA (red). The s.e.m. for the calculated free energy barriers is 0.08–0.14 kcal mol−1 (from ~300 replicate simulations).
