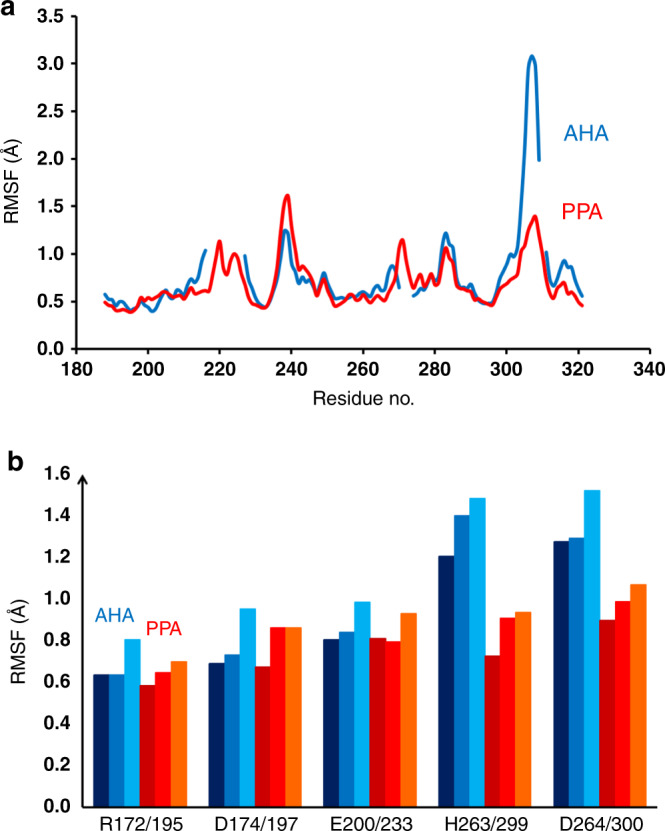
Fig. 4. Mobility differences between the psychrophilic and mesophilic enzymes.

a Calculated average backbone positional root-mean-square fluctuations per residue in the reactant state for AHA (blue) and PPA (red) in the sequence region comprising the active site and L7 loop (PPA residue numbering is used due to sequence insertions). b Average sidechain RMSF for active-site residues at 10, 25, and 40 °C. AHA results are shown in dark, medium, and light blue with increasing temperature and PPA results in a corresponding red scale.
