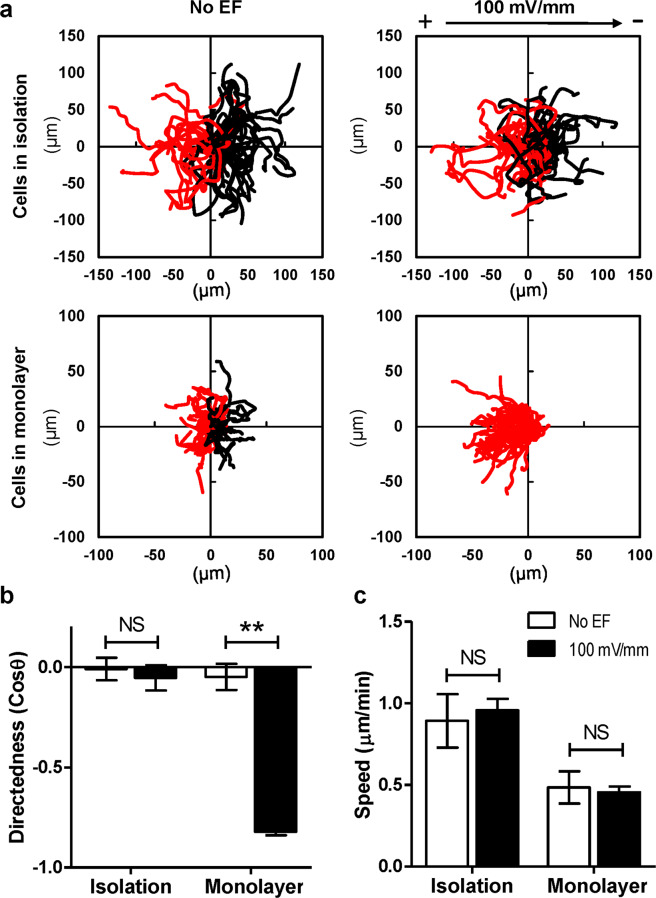
Figure 3.
Robust electrotaxis of breast cancer cells in monolayer, not in isolation. (a) Cell migration trajectories of isolated cells and monolayers from one representative experiment were plotted with a common origin. Black and red lines indicate trajectories of cells migrating toward cathode and anode (or left and right in no EF controls), respectively. (b,c) Directedness and migration speed of isolated cells and monolayers in a 100 mV/mm EF. Data are shown as mean ± SEM of three independent experiments. **P < 0.01, student-t test, compared with its no EF control.

