
Fig. 4. Overall plant–soil feedbacks on seedling growth for ECM and AM species.
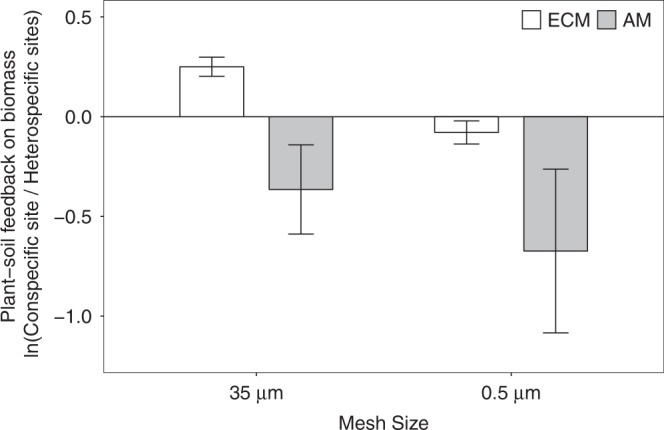
White: ECM tree species; grey: AM tree species. Values represent mean log response ratios ± s.e.m. (n = 3 independent focal species for each mycorrhizal type), which compared seedling mean biomass of in-growth cores at conspecific (n = 6 biologically independent seedlings) vs. heterospecific (n = 30 biologically independent seedlings) sites. Source data are provided in a Source data file.