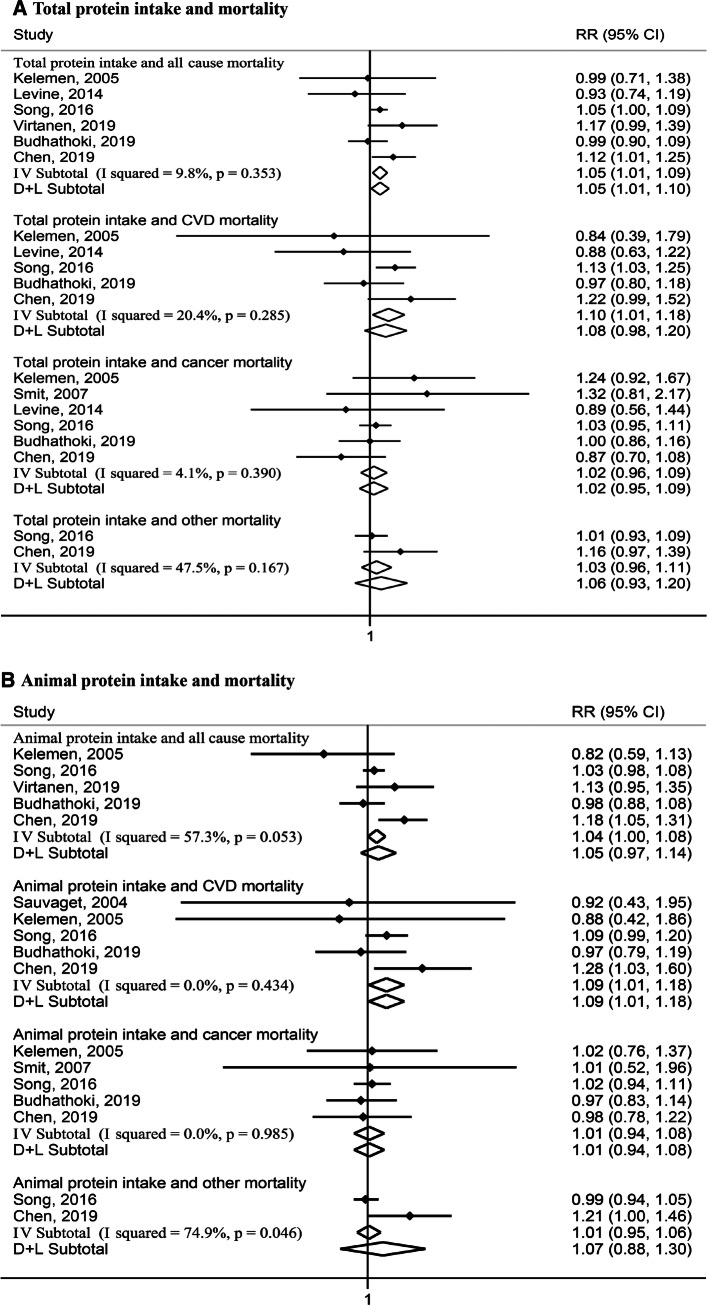
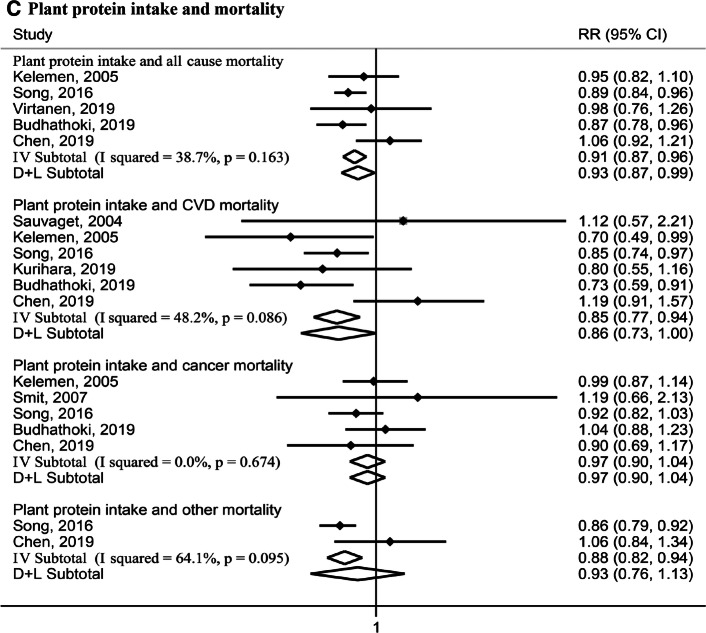
Fig. 1.
Relative risks (RRs) for the associations between protein intake (highest versus lowest categories) with all-cause and cause-specific mortality. Solid dots denote individual HRs, horizontal lines demote individual 95% CIs, open diamonds correspond to the pooled RRs including the 95% CIs, P values denote Pheterogeneity values, I–V Subtotal denotes fixed-effects analysis, and D + L Subtotal denotes random-effects analysis. CVD mortality cardiovascular mortality, RR relative risk, CI confidential interval. a, 59,841 all-cause deaths among 247,863 participants for total protein and all-cause mortality, 14,704 CVD deaths among 245,222 participants for total protein and CVD mortality, 21,591 cancer deaths among 25,499 participants for total protein and cancer mortality, 15,394 other deaths and 139,128 participants for total protein and other mortality. b 57,288 all-cause deaths among 241,482 participants for animal protein and all-cause mortality, 13,552 CVD deaths among 242,572 participants for animal protein and CVD mortality, 15,898 cancer deaths among 248,618 participants for animal protein and cancer mortality, 15,394 other deaths and 139,128 participants for animal protein and other mortality. c 57,288 all-cause deaths among 241,482 participants for plant protein and all-cause mortality, 13,906 CVD deaths among 250,316 participants for plant protein and CVD mortality, 28,953 cancer deaths among 248,618 participants for plant protein and cancer mortality, 15,394 other deaths and 139,128 participants for plant protein and other mortality


