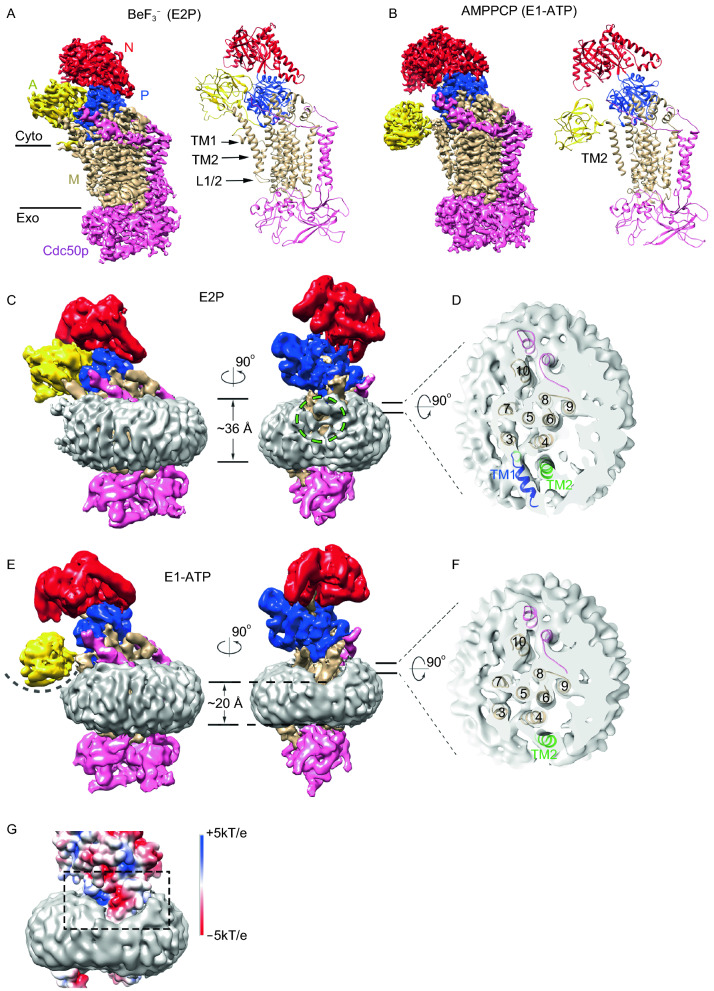
Figure 1.
Structures of ctDnf1p-Cdc50p. (A) Cryo-EM map (left panel) and ribbon diagram (right panel) of ctDnf1p-Cdc50p with BeF3−. The A, N, P, and M domains and Cdc50p are labeled and colored yellow, red, blue, tan, and pink, respectively. (B) Cryo-EM map (left panel) and ribbon diagram (right panel) of ctDnf1p-Cdc50p with AMPPCP. Colors are the same as in (A). (C) Cryo-EM density map of the E2P state with the lipid nanodisc. The map is low pass filtered to 6 Å. Colors are as in (A) with the addition of lipid nanodisc density (grey). Two views differing by 90° are shown. The green dashed circle marks the nanodisc density around TMs 1 and 2. The A domain is omitted in the right panel for clarity. (D) Cut-away top view of the nanodisc in (C) (right panel). TMs are labeled. (E) Cryo-EM density map of the E1-ATP state with the lipid nanodisc. The curved dashed line indicates the depression that is required to fit the A domain on the surface of the membranes. Membrane thickness is labeled. (F) Cut-away top view of the nanodisc in (E) (right panel). (G) Zoom-in view of (E) (right panel). The surface of ctDnf1p is colored according to the electrostatic potential. The black dashed frame highlights the distorted membranes and the negatively charged patch

