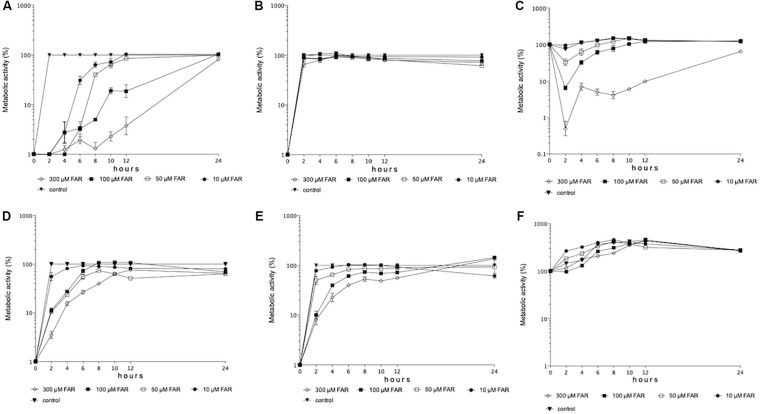
FIGURE 2.
Metabolic activity changes over time in case of biofilm formation in the presence of given farnesol concentrations (10–300 μM) for C. auris (A) and C. albicans (D), respectively. Metabolic activity changes over time in case of biofilm formation by farnesol pre-exposed cells (75 μM) in the presence of given farnesol concentrations (10–300 μM) for C. auris (B) and C. albicans (E), respectively. Metabolic activity changes over time for one-day-old preformed biofilms in the presence of given farnesol concentrations (10–300 μM) for C. auris (C) and C. albicans (F), respectively. Each time-point represents mean ± SEM (standard error of mean) of metabolic activity of clinical isolates (three independent experiments per isolate).

