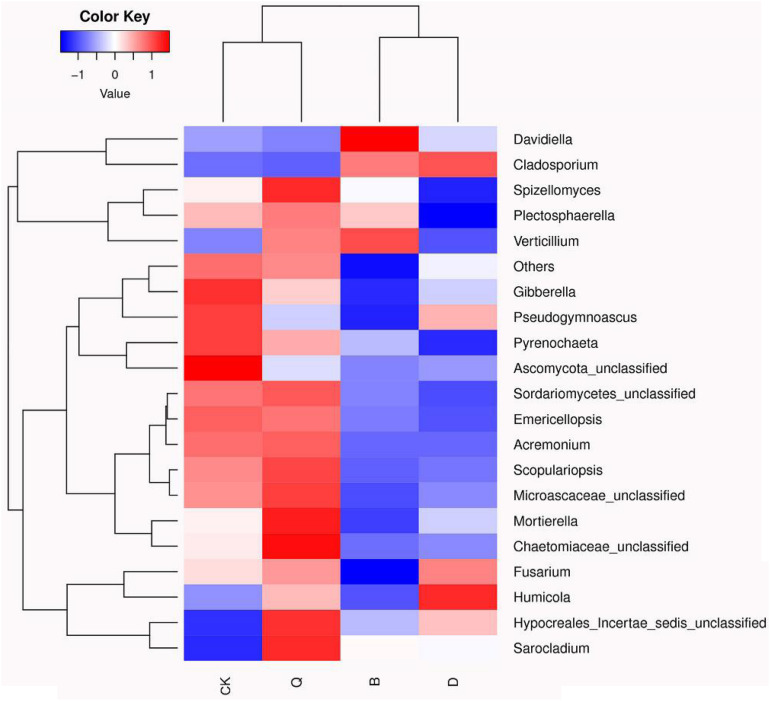
FIGURE 3.
Heatmap analysis of fungal communities in continuous tomato cropping substrates under different treatments. The color of relative abundance of the community changed from blue to red, indicating that the relative abundance of the community changed from low to high. Treatment abbreviations are defined in Figure 1.

