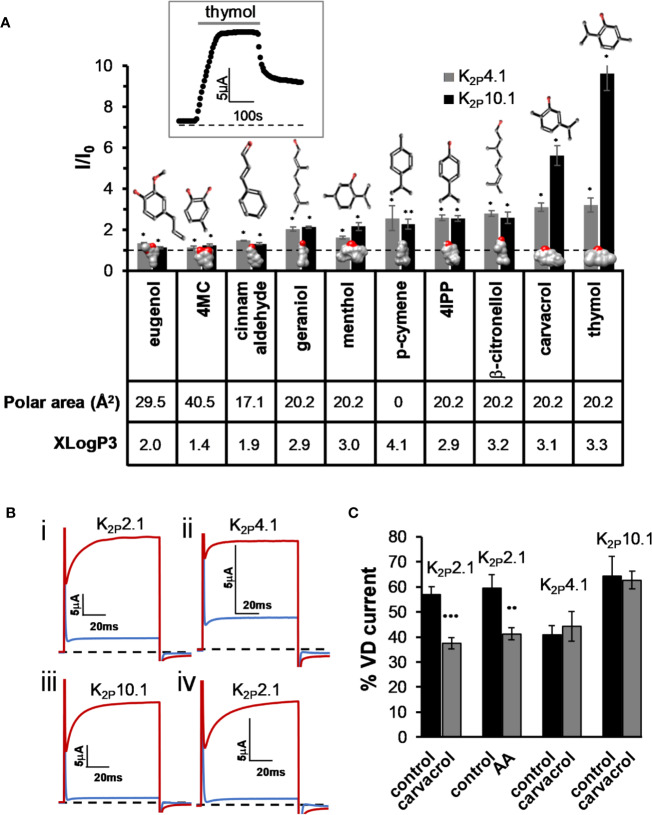
Figure 1.
Activation of K2P4.1 and K2P10.1 by monoterpenes. (A) Activation of K2P4.1 and K2P10.1. Oocyte membrane potential was held at −80 mV and pulsed to +25 mV for 75 ms with 5 s interpulse intervals. All MTs were applied at the same concentration (0.3 mM), and currents were measured after 4 min (mean ± S.E., n = 5–10). Polar area (Å2) and octanol–water partition coefficient (logP) prediction (XLogP3) were obtained from PubChem (Kim et al., 2016). 2D structures and the coordinates for the 3D structures of the terpenes were obtained from ChemSpider. 3D models were performed with the UCSF Chimera package (Pettersen et al., 2004). Oxygen molecules are colored red. The dashed line represents no change from the initial current. Inset- currents of a representative oocyte expressing K2P10.1 before, during and after thymol application. (B) Currents at 60 mV before (in red) and during (in blue) application of carvacrol (i–iii) or arachidonic acid (AA) (iv), on K2P2,1 (i, iv), K2P4.1 (ii), and K2P10.1 (iii) (C). Fraction of voltage-dependent current (in %) before (black) and after (gray) application of 0.3 mM carvacrol or arachidonic acid (AA, 100 µM). A fit of the current (at 60 mV) to an exponential decay slope was used to identify the initial current (mean ± S.E., n = 6–9).

