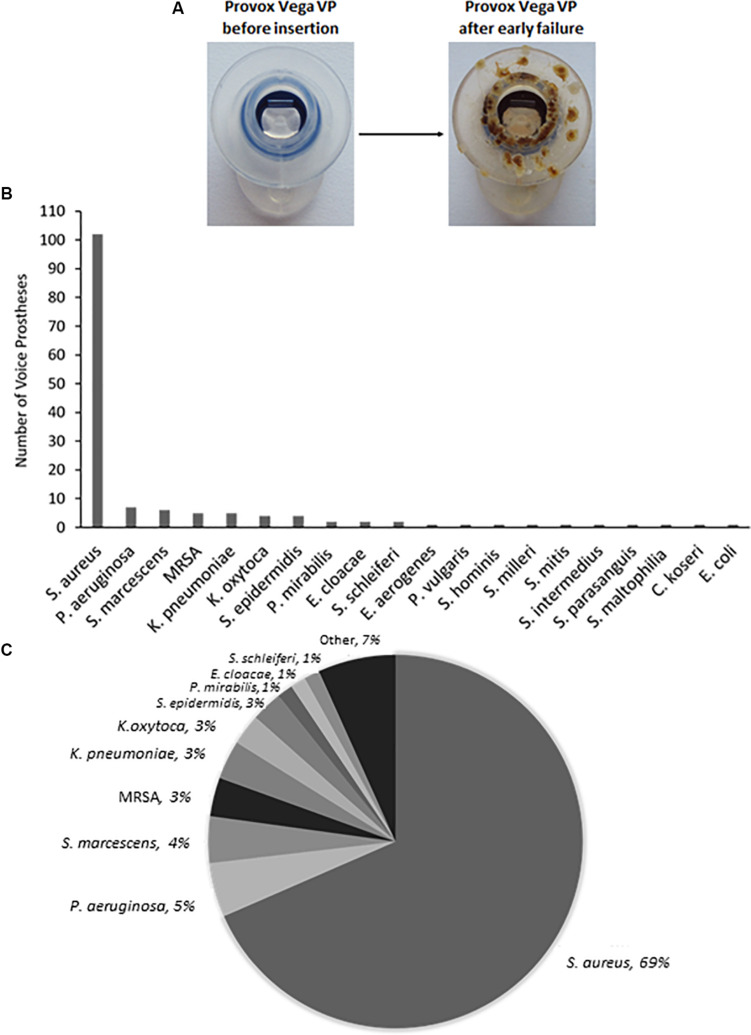
FIGURE 1.
The range and distribution of bacterial species found on voice prostheses within this study. (A) An example of a failed voice prosthesis removed from a patient. Note the ring of colonization on the prosthesis hood around the valve mechanism. (B) Bar graph representation of absolute numbers of times each bacterial species was isolated from 159 early failing VPs. (C) Pie chart representation of percentage of total bacteria isolated from 159 early failing VPs.

