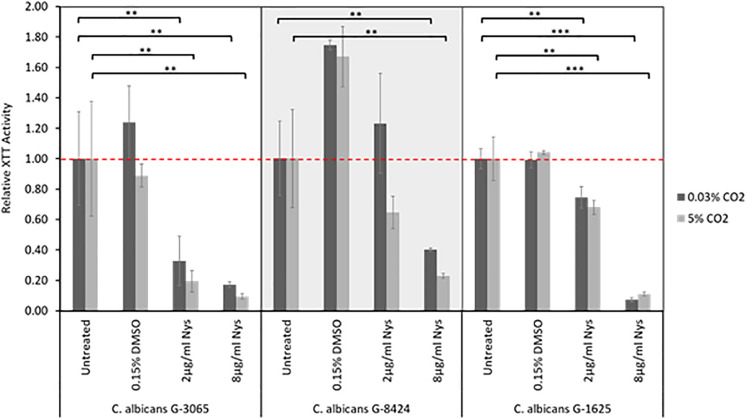
FIGURE 6.
Nystatin sensitivities of C. albicans clinical isolate biofilms. Biofilms were seeded and grown for 24 h before addition of Nystatin, they were then grown for a further 24 h before quantification using the XTT assay. The relative XTT activity is presented with the 0.03% CO2 biofilms being normalized to the 0.03% CO2 untreated control and the 5% CO2 biofilms being normalized to the 5% CO2 untreated control. This prevents the general higher growth of 5% CO2 biofilms impacting the analysis. Graphs represent three independent experiments each containing triplicates, error bars denote Standard Deviation. Two-way ANOVAs followed by a Tukey test for multiple comparisons were carried out: *p < 0.05, **p < 0.01, ***p < 0.001. Stars directly above the bars indicate a significant difference to untreated in the same CO2 environment.

