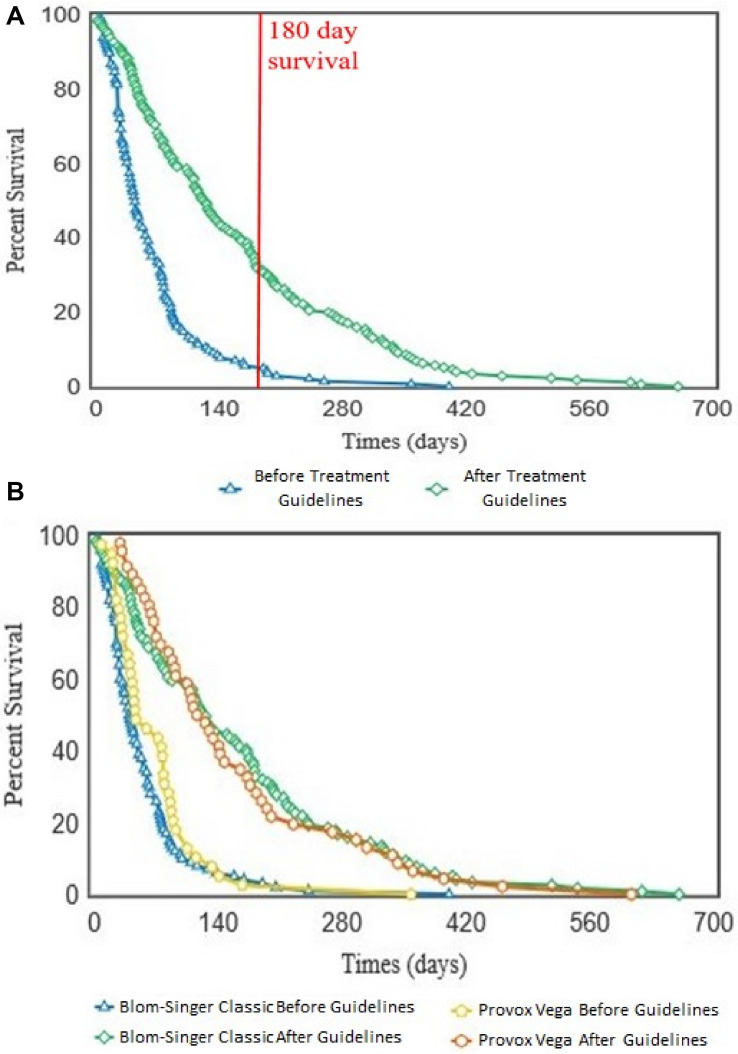
FIGURE 7.
Kaplan–Meier survival curves showing the voice prosthesis in situ lifespans before and after implementation of our antifungal treatment pathway. (A) Device lifespans were documented before and after implementation of the ATG. Kaplan–Meier survival curves were plotted using the OASIS2 online platform and a log-rank test was used to compare the survival curves: p < 0.001. Red line is at 180 days lifespan which we targeted as the ideal lifespan to achieve. (B) After lifespan analysis across all devices was performed, the lifespans were categorized into groups depending on which VP model a patient was using. Kaplan–Meier survival curves were again plotted using the OASIS2 online platform and log-rank tests were used to compare them: Blom-Singer Classic, Before vs. After; p < 0.001. Provox Vega, Before vs. After; p < 0.001.

