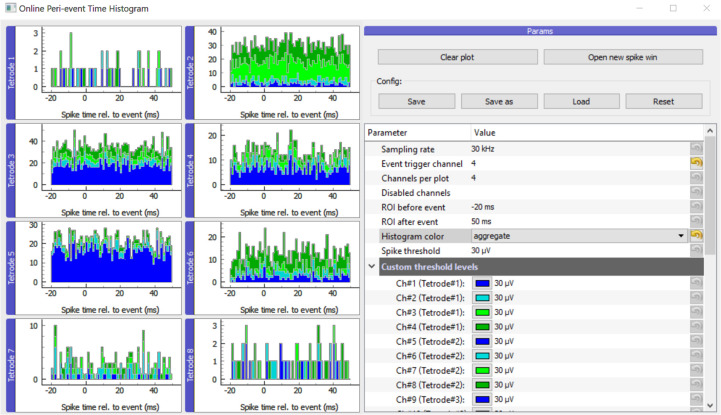
FIGURE 2.
Main GUI of OPETH. The histograms of the different channels or polytrodes are displayed on the left side of the window. The menu on the right side allows changing the parameters and interacting with the GUI. Histogram channels are collected in groups of four by default as for classical tetrode recordings. In order to adapt the plot to other channel configurations, the “Channels per plot” option can be set from 1 to 8 allowing visualization for single electrodes, stereotrodes or silicon probes.

