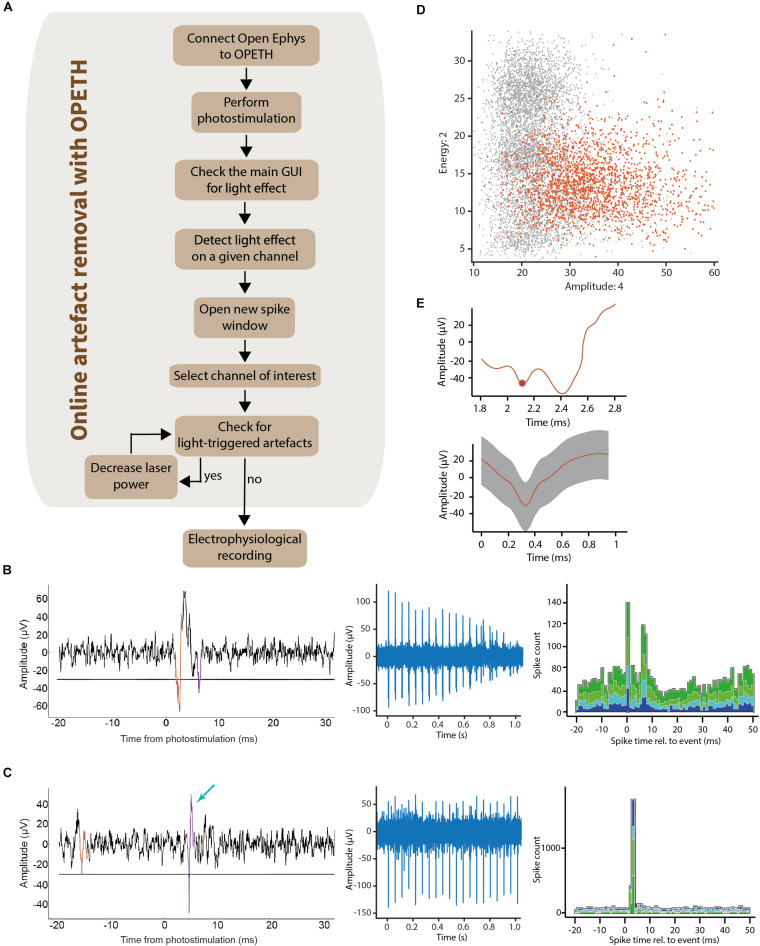
FIGURE 7.
Removing light-triggered artifacts from electrophysiological recordings. (A) It was possible to determine the channels affected by photostimulation by checking the main GUI during optogenetic tagging sessions. The raw signal was visualized using the “Open new spike window” button of the GUI. This allowed the experimenter to control laser intensity until light-triggered artifacts disappeared from the plots. (B) Left, raw data of the light-evoked artifact aligned to photostimulation (waveform superimposed in color). Middle, decreasing the laser intensity lead to decreasing amplitude of the artifacts. Right, the corresponding OPETH histogram showed a bimodal PETH caused by the “W shape” of the light-evoked artifacts. (C) Left, raw data of a light-evoked spike (waveform superimposed in color, indicated by blue arrow). Middle, the all-or-none spikes did not show amplitude changes upon decreasing stimulation intensities. Right, corresponding online histogram in the main OPETH window. (D) Waveforms plot in feature space showed a high dispersion of the light-evoked artifacts (orange). (E) Top, raw signal of the light-evoked artifact in the OPETH Spike window. Bottom, average artifact waveform in the offline analysis.

