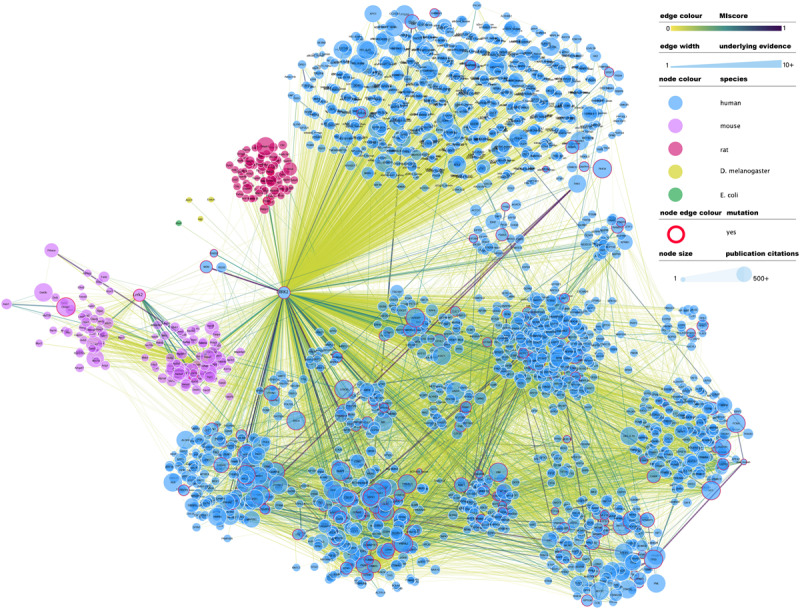
FIGURE 1.

Full LRRK2 interactome as extracted from the IntAct database. Edges represent composite of multiple physical interaction evidence. Interactions between LRRK2 interacting partners have been also added and dimmed to emphasize connection to LRRK2 specifically and roughly interconnected communities have been clustered together. Node size has been mapped to the number of publications in which that protein/gene has been mentioned according to NCBI gene2pubmed table (available at ftp://ftp.ncbi.nih.gov/gene/DATA/gene2pubmed.gz and downloaded on 18/11/2019). Red-rimmed nodes represent proteins with annotations about mutations affecting interaction outcome in IntAct. For the rest of the visual features, see in-figure legend. An interactive and downloadable version of this network can be found at http://ndexbio.org/#/network/e6af2dc5-42b7-11ea-bfdc-0ac135e8bacf.
