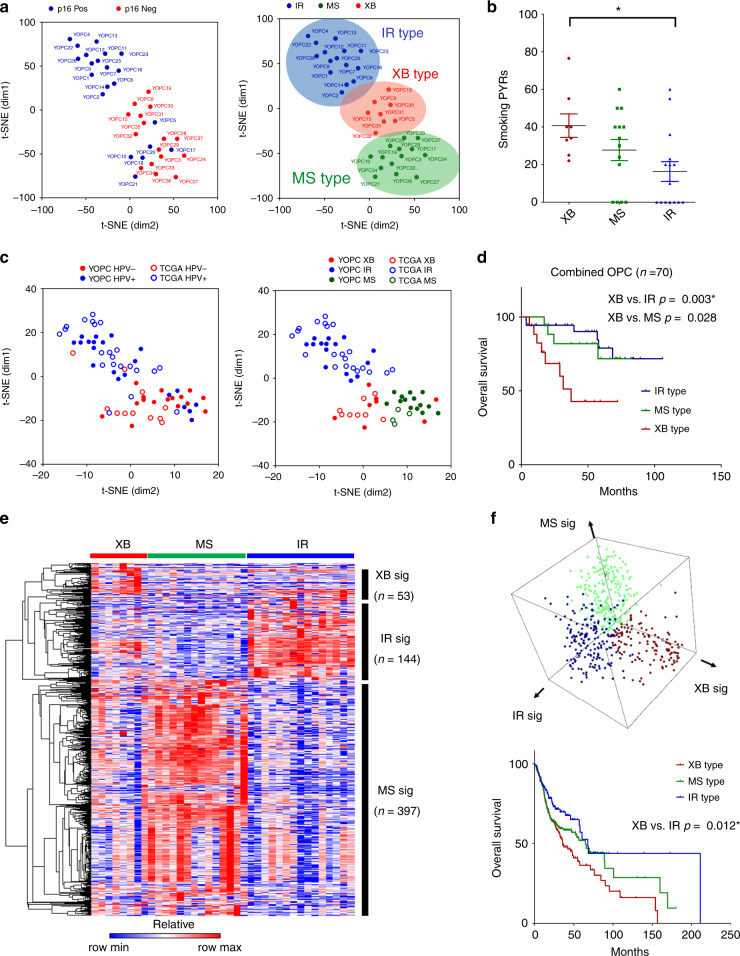
Fig. 1. Three molecular subtypes of OPC identified by RNA-seq analysis of tumours show different survival outcomes.
a The two-dimensional t-SNE plot of RNA-seq data from 37 surgically resected OPC tumours (YOPC) with p16 IHC status. The k-means clustering analysis classifies the tumours into three subtypes: immune-rich (IR), mesenchymal (MS) and classic (CL) type. The patient number (YOPC) corresponds to the plots. b Comparison of smoking doses of patients among three subtypes. The smoking dose in pack-years (PYR) was compared using Kruskal–Wallis test with post hoc analysis using Dunn’s multiple comparison test. The difference between XB and IR type OPCs was statistically significant (p < 0.05) in the post hoc analysis and indicated with the asterisk (*p < 0.05). c The t-SNE plotting for OPC tumours of the combined cohort, which consists of 37 OPC tumours from patients at the Yonsei Cancer Center (YOPC) and 33 HNSC TCGA tumours of oropharyngeal origin (the soft palate, the base of tongue, the tonsils and the side and back wall of the throat). The subtype of TCGA OPC tumours was determined by k-means clustering. d The Kaplan–Meier curves for overall survival of OPC patients in the combined cohort. The patient survival was compared using log-rank test. The difference between XB and IR type OPCs was statistically significant (p < 0.167) after the Bonferroni post hoc correction and indicated with the asterisk (*). e The heatmap of significantly altered genes among three subtypes (log2 fold change ≥2 and p value < 0.05). The CL-, IR- and MS-specific gene signatures were selected according to their expression in each subtype. f The three-dimensional plotting and k-means clustering analysis using gene set enrichment score of each subtype signature derived from e calculated by GSVA algorithm in 518 HNSC TCGA patients (upper panel). The Kaplan–Meier curves for overall survival of 518 HNSC TCGA patients according to subtype classification (lower panel). The difference between XB type vs. IR type OPCs was statistically significant (p < 0.167) after the Bonferroni post hoc correction. Throughout the figures, data are mean and SEM.

