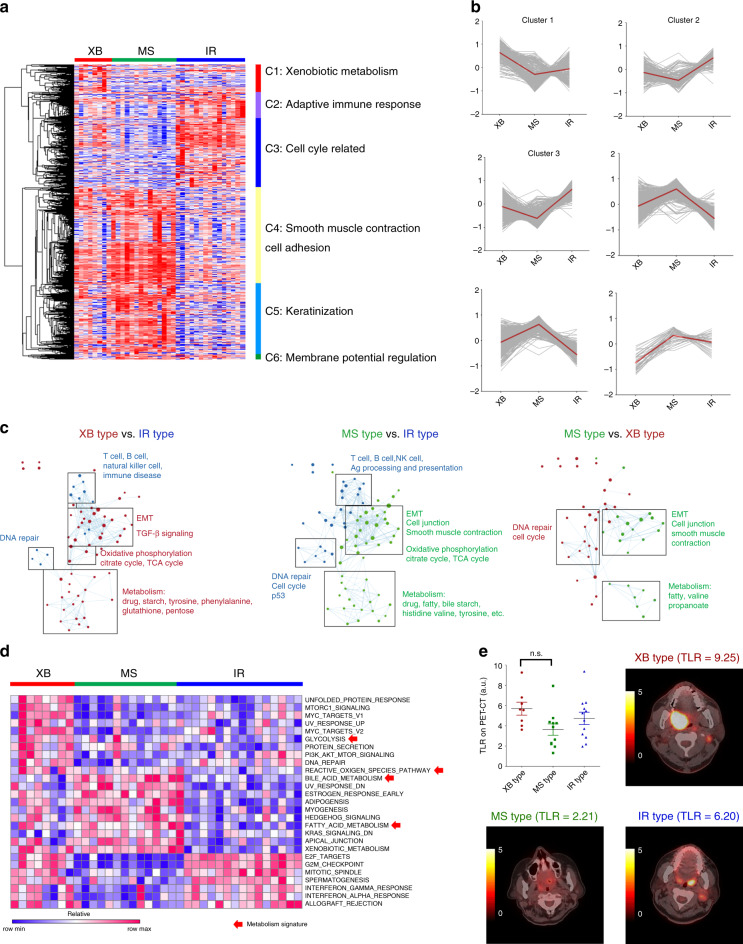
Fig. 2. Characterisation of subtype-specific gene signatures.
a The differentially expressed genes among the subtypes (log fold change ≥1 and p value < 0.05) were categorised into six clusters: xenobiotic metabolism (C1), adaptive immune response (C2), cell cycle-related (C3), smooth muscle contraction and cell adhesion (C4), keratinisation (C5) and membrane potential regulation (C6) genes in 37 surgically resected OPC tumours (YOPC). b Subtype-specific expression of six cluster genes. The average z-score expression of each gene is shown by a grey line, and the average z-score expression of all genes is shown by a red line. c The network analysis of differentially expressed genes via pair-wise comparison of each subtype using Enrichment map software in 37 YOPC tumours. d The heatmap showing enrichment score of hallmark gene signatures (H) in MSigDB on GSVA. Red arrows indicate the gene signatures related to metabolism in 37 YOPC tumours. e Tumour-to-liver uptake ratio (TLR) from F-18 FDG PET-CT scan of OPC tumours according to their subtype. The pre-operative PET-CT scan was available in 31 out of 37 OPC tumours, and the representative PET/CT images of subtypes are shown. The TLR values were compared using one-way ANOVA with Bonferroni post hoc test. The difference between XB type and MS type OPCs was statistically insignificant in the post hoc analysis. n.s., Not significant.

