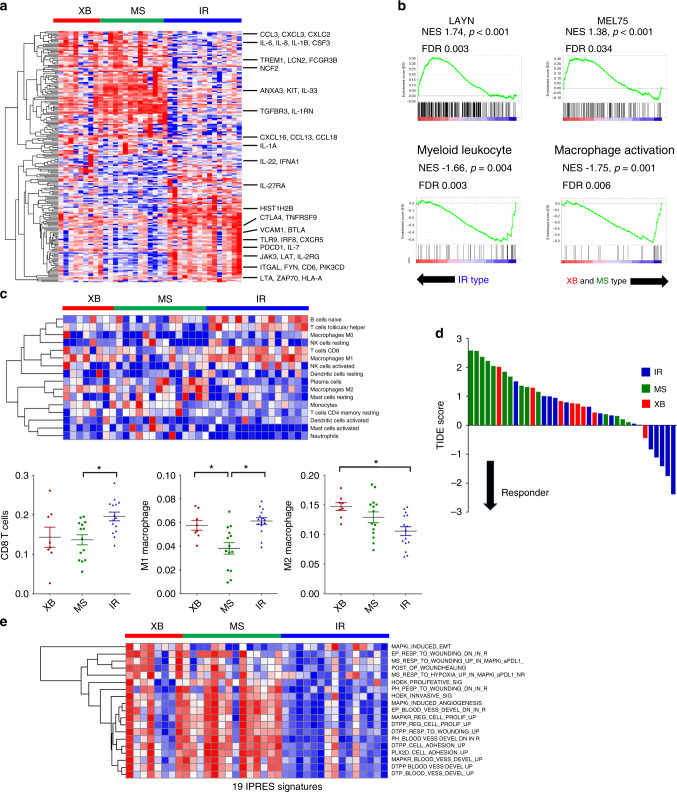
Fig. 3. Distinct tumour immune microenvironment of OPC subtypes revealed by RNA-seq.
a Significantly altered immune-related genes (log2 fold change ≥1 and p value < 0.05 in GO term immune response: GO:0006955) among three subtypes. The representative genes related to T cell adaptive immune response and macrophage/granulocyte activation are indicated. b GSEA of expression profile comparing IR type vs. XB and MS types using T cell exhaustion (LAYN and Mel75) and myeloid cell activation (GO:0002274: myeloid leucocyte activation and GO:0043030: regulation of macrophage activation) gene signatures. c Immune cell composition analysis using the CIBERSORT deconvolution method. The heatmap showing the relative fraction of various types of immune cells in OPC tumours (the upper panel). The dot plot showing ratio of CD8+ T cells, M1 macrophages and M2 macrophages in OPC tumours (the lower panels). The proportion of the cells was compared using one-way ANOVA with Bonferroni post hoc test. The statistically significant results per post hoc analysis are indicated with asterisks (*p < 0.05). d The waterfall plot of TIDE prediction score of 37 OPC tumours. The molecular subtype is indicated by a different colour. A low TIDE score means a high probability of response to immune checkpoint blockade therapy. e The heatmap of the gene set enrichment score of 19 IPRES gene sets calculated by GSVA in 37 OPC patients.

