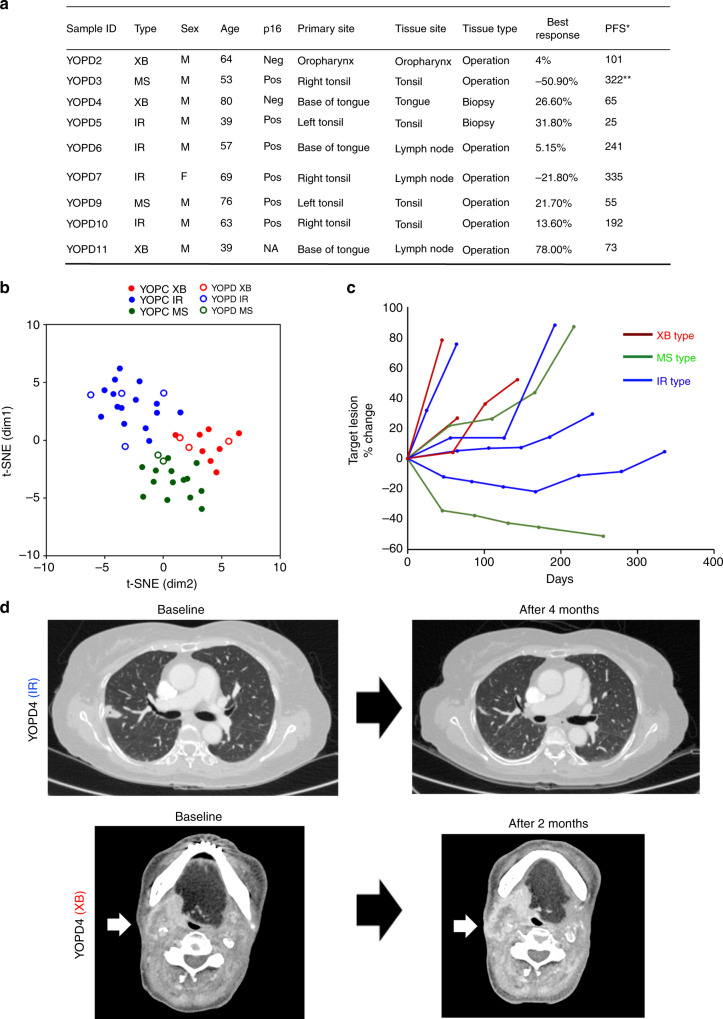
Fig. 6. The molecular subtype predicts response to anti-PD-1/PD-L1 therapy in OPC patients.
a The patient list and clinical characteristics of nine recurrent or metastatic OPC patients receiving anti-PD-1/PD-L1 therapy (YOPD). *The best response was determined by RECIST 1.1 criteria. **Patient still undergoing anti-PD-1/PD-L1 therapy. b The t-SNE plot for nine YOPD tumours combined with 37 YOPC tumours. The subtype of YOPD tumours was determined by distance from 37 YOPC tumours on the t-SNE plot. c Spider plot showing changes in target lesion diameters on anti-PD-1/PD-L1 therapy in nine OPC tumours according to subtype. d Representative CT scan images of IR type and XB type tumours on anti-PD-1/PD-L1 therapy.

