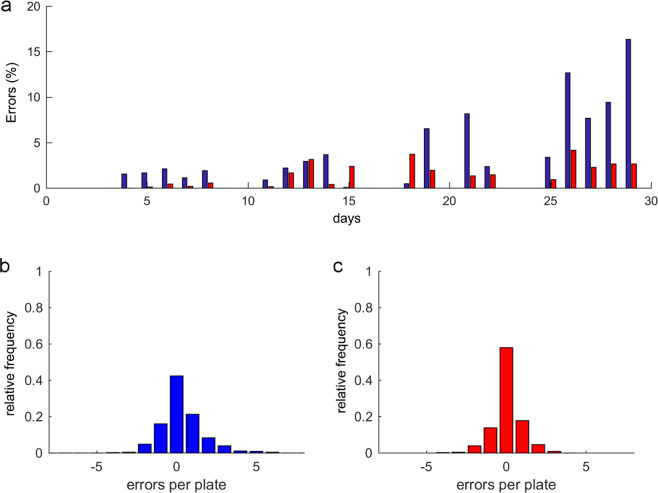
Figure 10.
Error analysis. The error is E = Automated count – ground truth. Thus negative errors are non-detected worms (false-negative) and positive errors are detected contamination (false-positive). (a) is the absolute error percentage per day of the whole population, and the automated error (blue bars) is compared to the filtered result error by post-processing (red bars). (b) shows the automated error frequency distribution per plate for all three experiments with a positive or negative sign (in individuals), while (c) is the post-processing error frequency distribution.

