Figure 5.
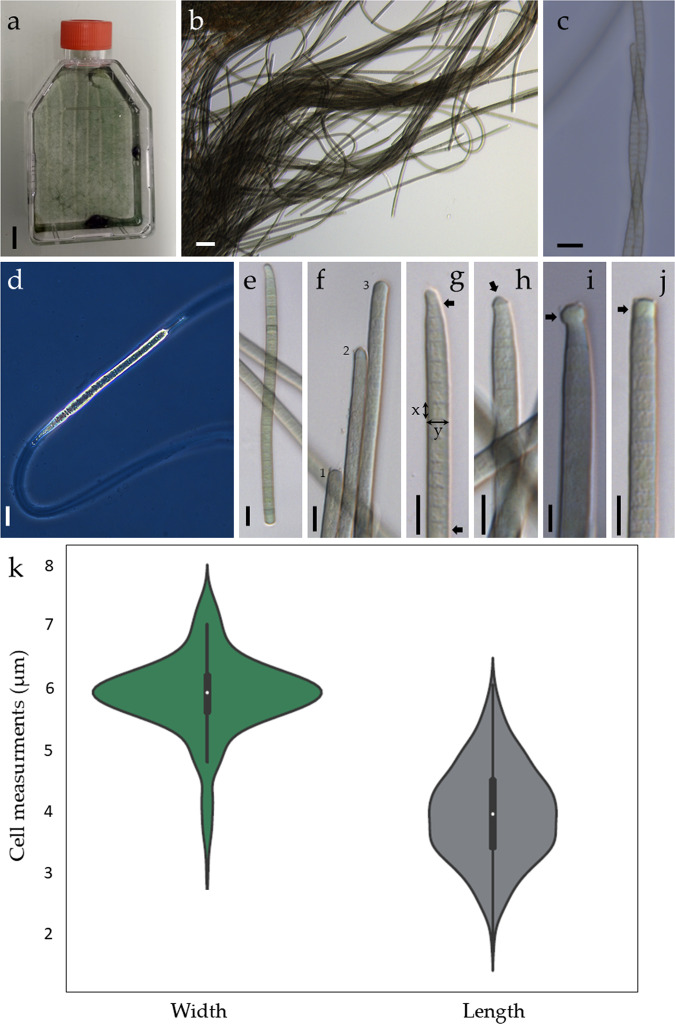
Morphology and morphometry of Microcoleus asticus sp. nov.: (a) mat in culture conditions (scale bar 1 cm); (b) filaments in low magnification; (c) entangled filaments; (d) surrounding sheath in phase contrast; (e) heteropolar filament; (f) variation in end cell morphology in straight filaments: 1 – truncated, 2 – conical, 3 – broadly rounded; (g) tapered filament, note a reduction of 64% in cell width towards the end between the two arrows, the lines represents the cell morphometric measurements, x - length, y – width; (h) tapered filament with a calyptra (arrow); (i,j) filaments with spherical and square hyaline membranous structures (arrows); (k) distribution density of the cells widths and lengths, the white dot indicates the median and the black bar represents the interquartile range, the black line represents the 95% confidence intervals after 500 measurements. Scale bars 10 µm.

