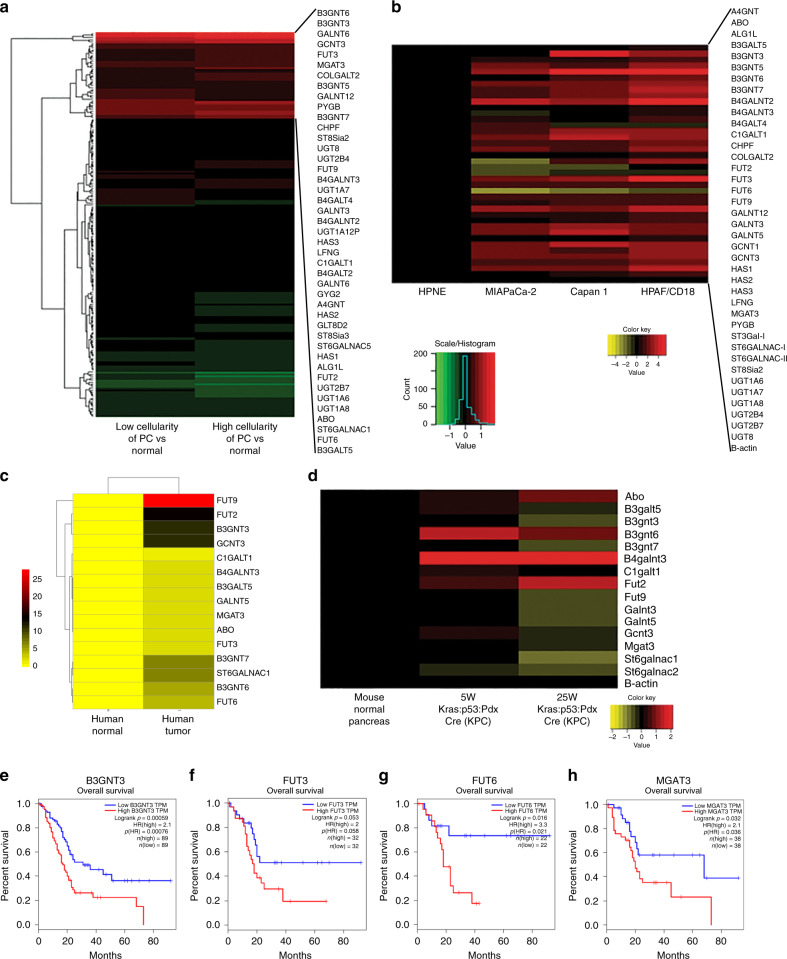
Fig. 1. Transcriptomic analysis of glycoTs.
a Heatmap based on the RNAseq analysis for more than 200 glycoTs in high cellularity (tumour), low cellularity (tumour) and normal patients as obtained from the TCGA datasets. b RT-qPCR analysis for 39 glycoTs in HPNE, MIAPaCa-2, Capan-1 and HPAF/CD18 cell lines. c RT-qPCR analysis for the 17 glycoTs in human tissues based on normal pancreas (N = 3) and pancreatic tumour (N = 3). d RT-qPCR for mouse glycoTs in the normal animal, 5-week-old KPC and 25-week-old KPC animal. e–h Survival plots were obtained from the gepia dataset and reported for B3GNT3, FUT3, FUT6 and MGAT3.

