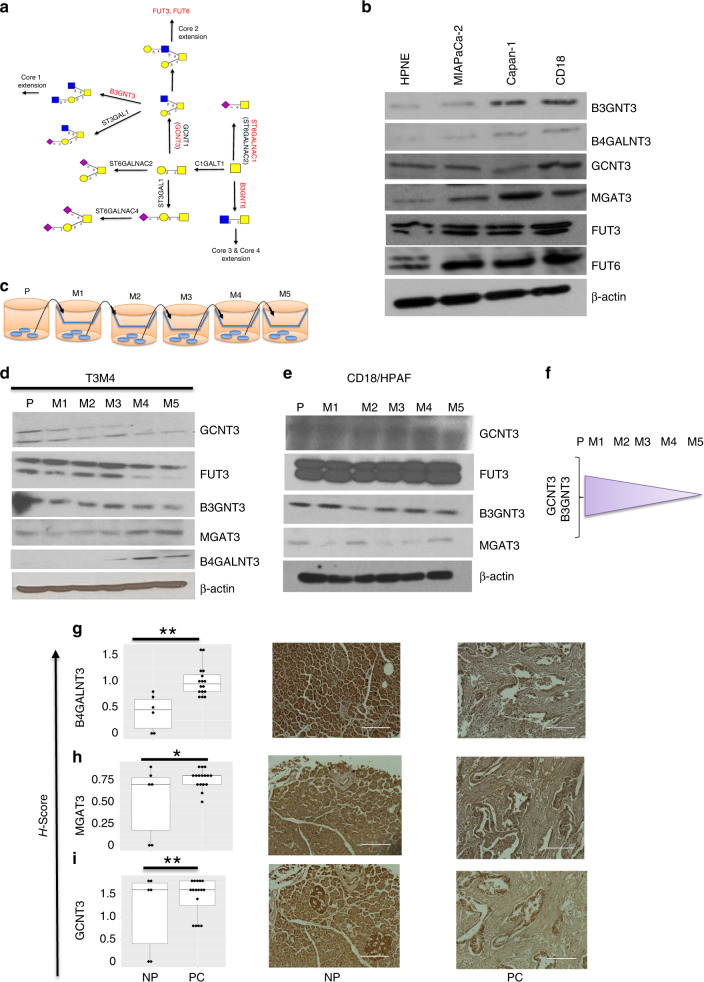
Fig. 2. Translational and IHC based analysis to probe glycoTs.
a Schematic showing the progression of O-glycosylation in human systems. b Immunoblots for the selective glycoTs B3GNT3, B4GALNT3, FUT3, FUT6, GCNT3 and MGAT3 in the HPNE, MIAPaCa-2, Capan1 and HPAF/CD18 cell lines. c Schematic showing the generation of metastatic cell lines from P to M5. d, e Immunoblots for the above stated glycoTs in the metastatic cell lines of T3M4 and HPAF/CD18. f Schematic illustrating the changes in the expression of glycoTs from P to M5. g–i Immunohistochemistry analysis for B4GALNT3, MGAT3 and GCNT3 in normal pancreas and pancreatic cancer tissues. Representative images corresponding to the normal pancreas and pancreatic adenocarcinoma tissues are mentioned. Details of the approach used is mentioned in methods section. * indicates p < 0.05 and ** indicates p < 0.005 in all the cases.

